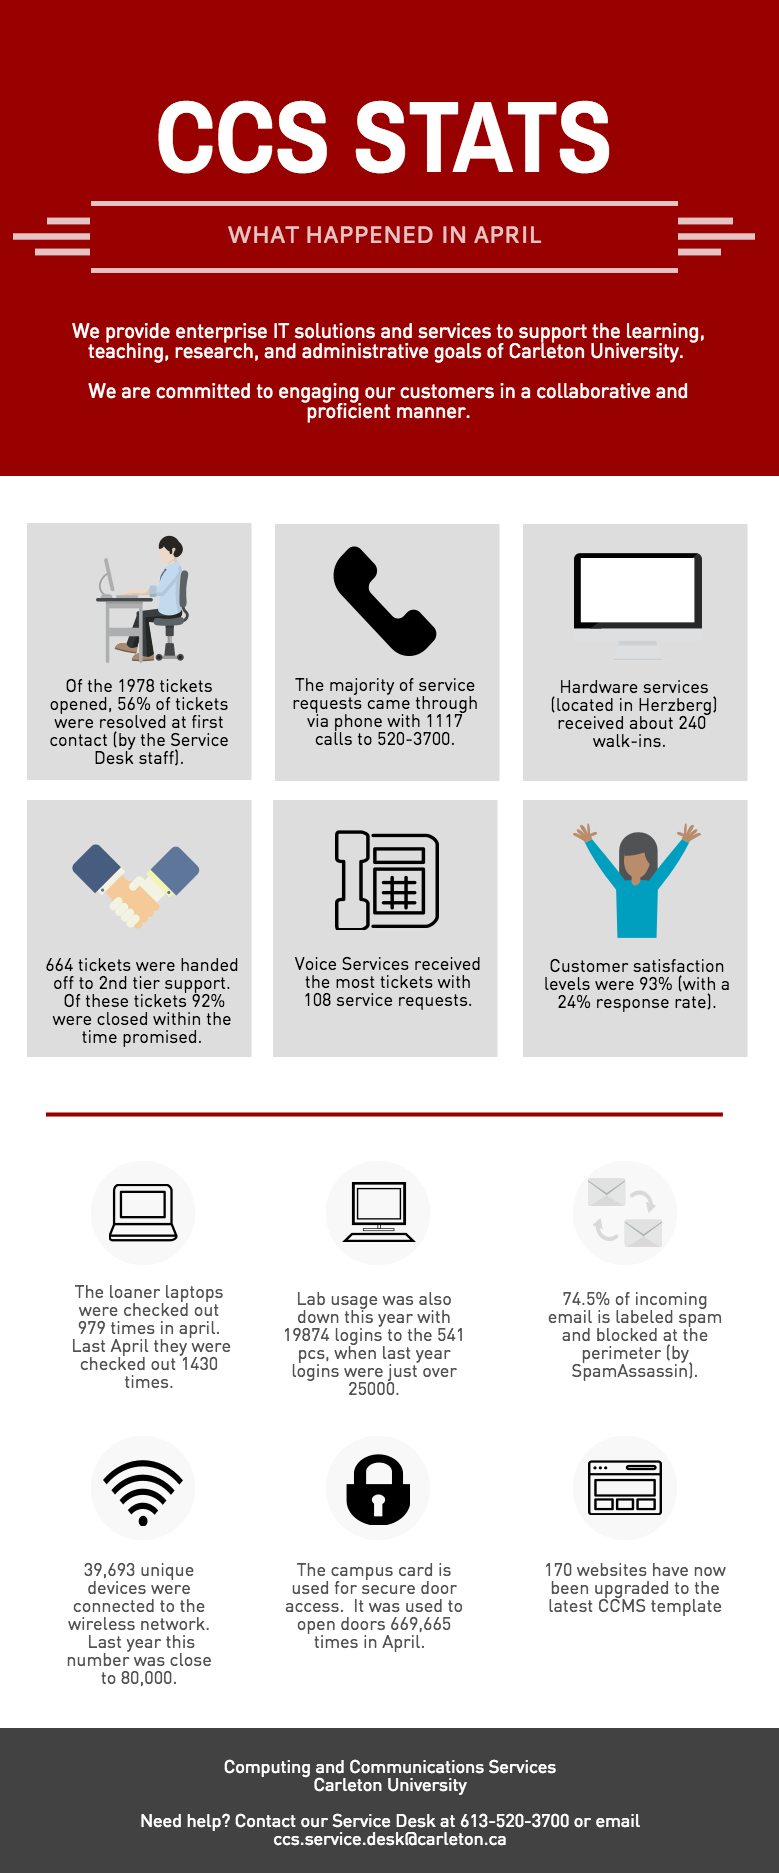
The infographic below highlights some of the activity we saw in the month of April. Click on the image for a larger view. Accessible transcript is included below the image.
Accessible Transcript
ITS Stats – What Happened in April
We provide enterprise IT solutions and services to support the learning, teaching, research, and administrative goals of Carleton University.
We are committed to engaging our customers in a collaborative and proficient manner.
- Of the 1978 tickets opened, 56% of tickets were resolved at first contact (by the Service Desk staff)
- The majority of service requests came through via phone with 1117 calls to 520-3700.
- Hardware services (located in Herzberg) received about 240 walk-ins.
- 664 tickets were handed off to second tier support. Of these tickets 92% were closed within the time promised.
- Voice Services received the most tickets with 108 service requests.
- Customer satisfaction levels were 93% (with a 24% response rate)
- The loaner laptops were checked out 979 times. Last April they were checked out 1430 times.
- Lab usage was also down this year with 19874 logins to the 541 pcs, when last year logins were just over 25000.
- 74.5% of incoming email is labeled spam and blocked at the perimeter (by SpamAssassin).
- 39,693 unique devices were connected to the wireless network. Last year this number was close to 80,000.
- The campus card is used for secure door access. It was used to open doors 669,665 times in April.
- 170 websites are now in the latest CCMS template
