How do you know if a page or post is performing well on your website? You check your analytics reports, of course.
But what does ‘performing well’ mean?
There are hundreds of reports available to you in Google Analytics, and it’s important to know which ones to look at to determine whether or not your website is performing well.
But before you even open your analytics reports, there are a few questions you should ask. Asking these questions first will help you to know what reports you should look at to find your answers.
Here are some sample questions with the reports that will help provide answers.
How many people do you expect to read the post?
You check your report and see that 50 people have read the post. Is that good? Bad? Having a goal in mind is crucial in oder to determine whether or not the post is successful.
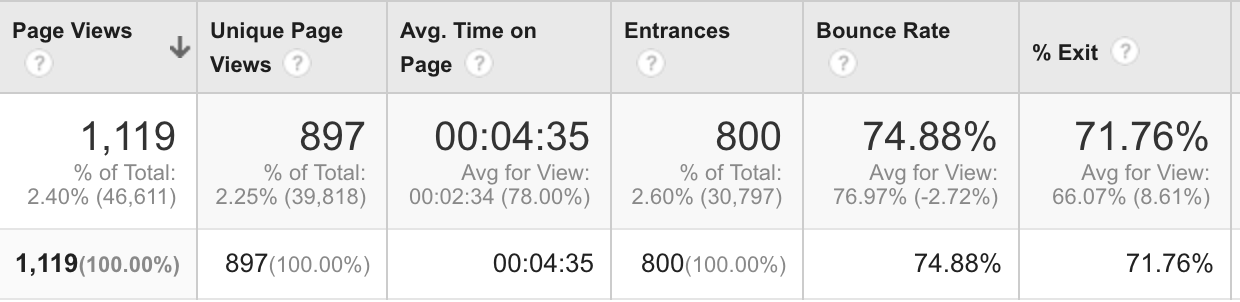
To see how many people have viewed your post, click on the behaviour report and search for the page.
How much time does it take to read the post?
Just because people landed on the post, does not mean they’ve actually read it. Looking at your time spent on page can give you an indication of whether or not they stayed long enough to read the post. Now, this one is tricky because perhaps a visitor came, skimmed the article, found what they were looking for then moved on. Just go in with an idea in mind of how much time you’d like them to spend, and then you’ll have a baseline number for success.
When you look at your behaviour report you will see a list of data points, one of which is time spent on page.
What channels are you using for promotion?
If your main channel for promotion on that post was via social media, then you want to check to see how it performed there. Looking at your traffic reports for specific pages will give you this insight. This one is a bit tricky to access, but very worth it for page specific information.
To see your traffic on a specific page or post click on the page within the behaviour report. Then from the ‘secondary dimension’ drop-down menu, click ‘acquisition’ and ‘medium’ for general search traffic or ‘sources’ for specific social media channels.
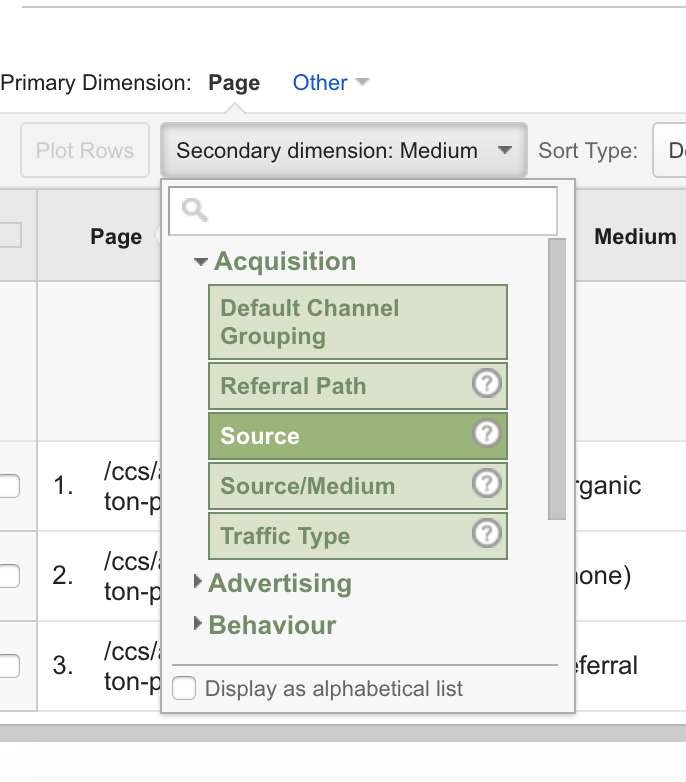
Have you optimized it for search engines?
if your page has been optimized, you’ll want to see how it is performing in search engines. Again, follow the instructions above, and choose ‘medium’ from the acquisition drop down menu. If it’s not doing so well, perhaps you are not targeting the right keywords, or those keywords are not in the optimal areas.
Where do you want people to go after they’ve read the post?
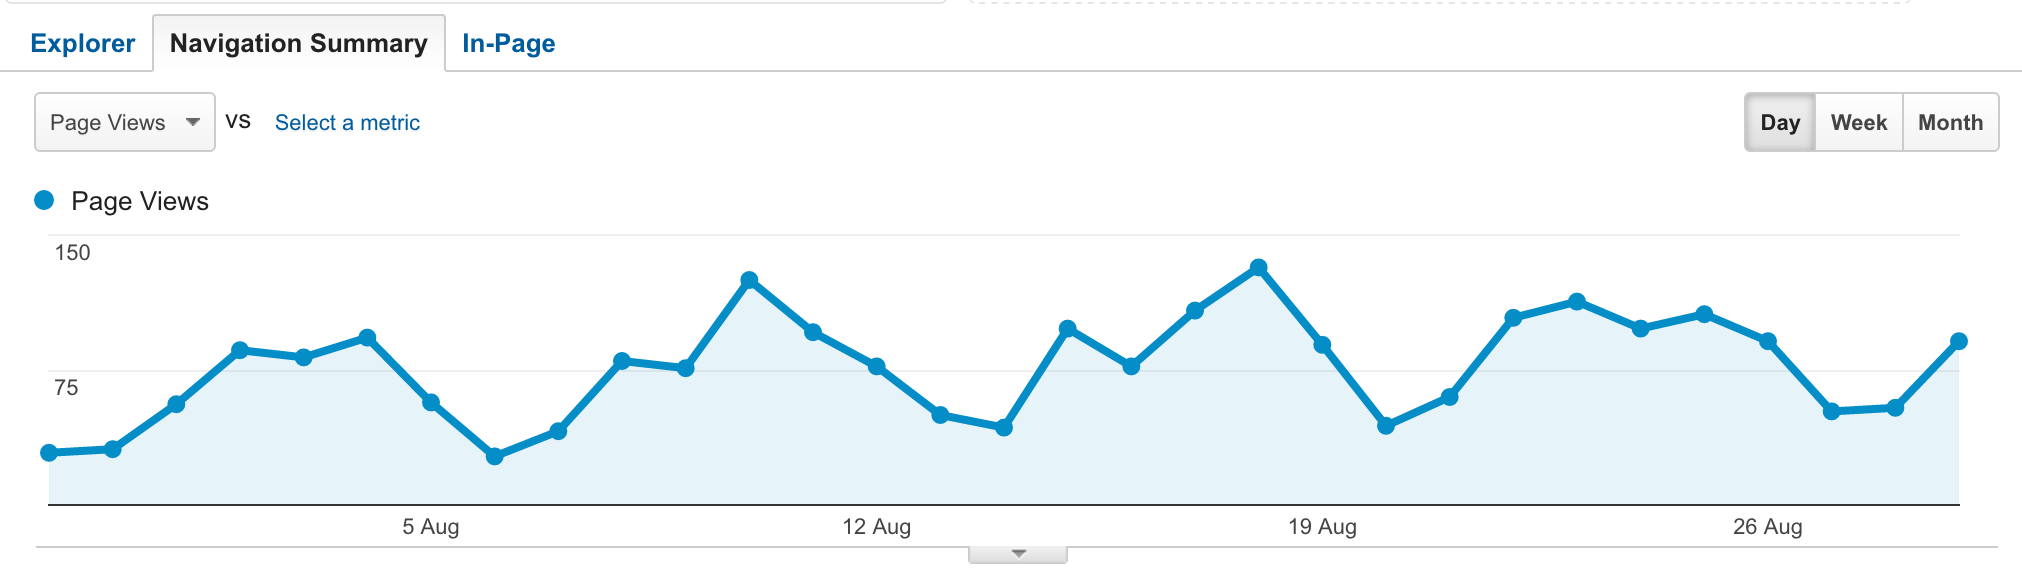
Do you have a call to action on your page? If yes, did they click on it and follow the path you set out. If you don’t have a call to action, perhaps you need to add one. Or simply decide what you want people to do with this information. There are two things you can look at here: bounce rate and navigation summary. The bounce rate will tell you if people only looked at your one page, then left your site. Your navigation summary will tell you where they went next on your website.
To view your navigation summary report, just click on the page within behaviour reports, then click on the ‘Navigation Summary’ tab located above your trending graph.
Want to learn more?
We’ll be covering questions like this and so many more in our next Site Content Review workshop. Sign up now, seats are limited.