So What Did We Find?
Our study resulted in many different findings that were differentiated between population groups and the remaining Ottawa adult population. Identified below are some of the study’s highlights:
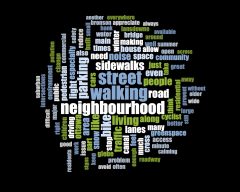
Walkability
Using postal codes, we determined the Walk Score® of our survey respondents’ neighbourhoods, and found that high neighbourhood Walk Score® was associated with increased likelihood to walk, decreased travel by car, and higher levels of physical activity. A high neighbourhood Walk Score® was also associated with a lower Mental Health Summary score, particularly in respondents with a mobility restriction. This could potentially be explained by neighbourhood population or traffic density; high Walk Score® areas tend to be the more dense and busy neighbourhoods, and may be conducive to high stress, especially if navigating with a mobility restriction.
Survey respondents had an average Walk Score® of 65
Bikeability
Though no significant difference was found between Physical Health Score and cycling frequency, Bike Score was associated with reduced car trips, which could be interesting for a Building a Liveable Ottawa 2031 perspective.
Roadways and Traffic
 We compared distance to major roadways to mean Physical and Mental Health Summary scores, but found no significant differences between physical health and distance to major road; however, there was a positive trend of greater Mental Health Scores and increasing distance to major roadway among all survey participants. Among our sub-population groups, this trend was present among parents but not seniors or populations with mobility restrictions. Of the entire survey sample, the average distance to a major roadway was 0.32 km, with a range from 0 – 2 km. There were no relationships between traffic volume and safety among all participants and sub-populations.
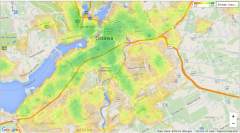
Recreational and Green Spaces
Participants living in areas with more recreational spaces (i.e. parks, sports fields, and indoor fitness facilities) measured higher Physical Health Summary scores; these associations were more pronounced amongst people with mobility restrictions.
Green space was measured through satellite imaging data (NDVI). There was no clear relationship between green space and physical health. Our analysis showed a slight positive association between green space and mental health, though this relationship was not significant across either the entire sample nor the subpopulation samples.
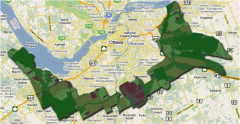
City of Ottawa measures of green space
Outdoor Lighting
Lighting was measured using self-reported measures of likelihood of encountering adequate lighting on streets. We found that respondents living in areas with better street lighting indicated statistically significantly higher perceptions of safety. This trend was present among seniors but not among parents or populations with mobility restrictions.
Additional Findings: Safety and Physical Activity
When we split the safety data into two halves (safe and unsafe) and compared it to the mean physical activity hours between the halves, respondents with higher perceptions of safety also had statistically significant higher mean walking frequencies, and mean hours of physical activity per week. Therefore, this provides incidental evidence that greater perceptions of safety is associated with higher physical activity.
What were some of the most Desired Changes?