PixPlot is Awesome
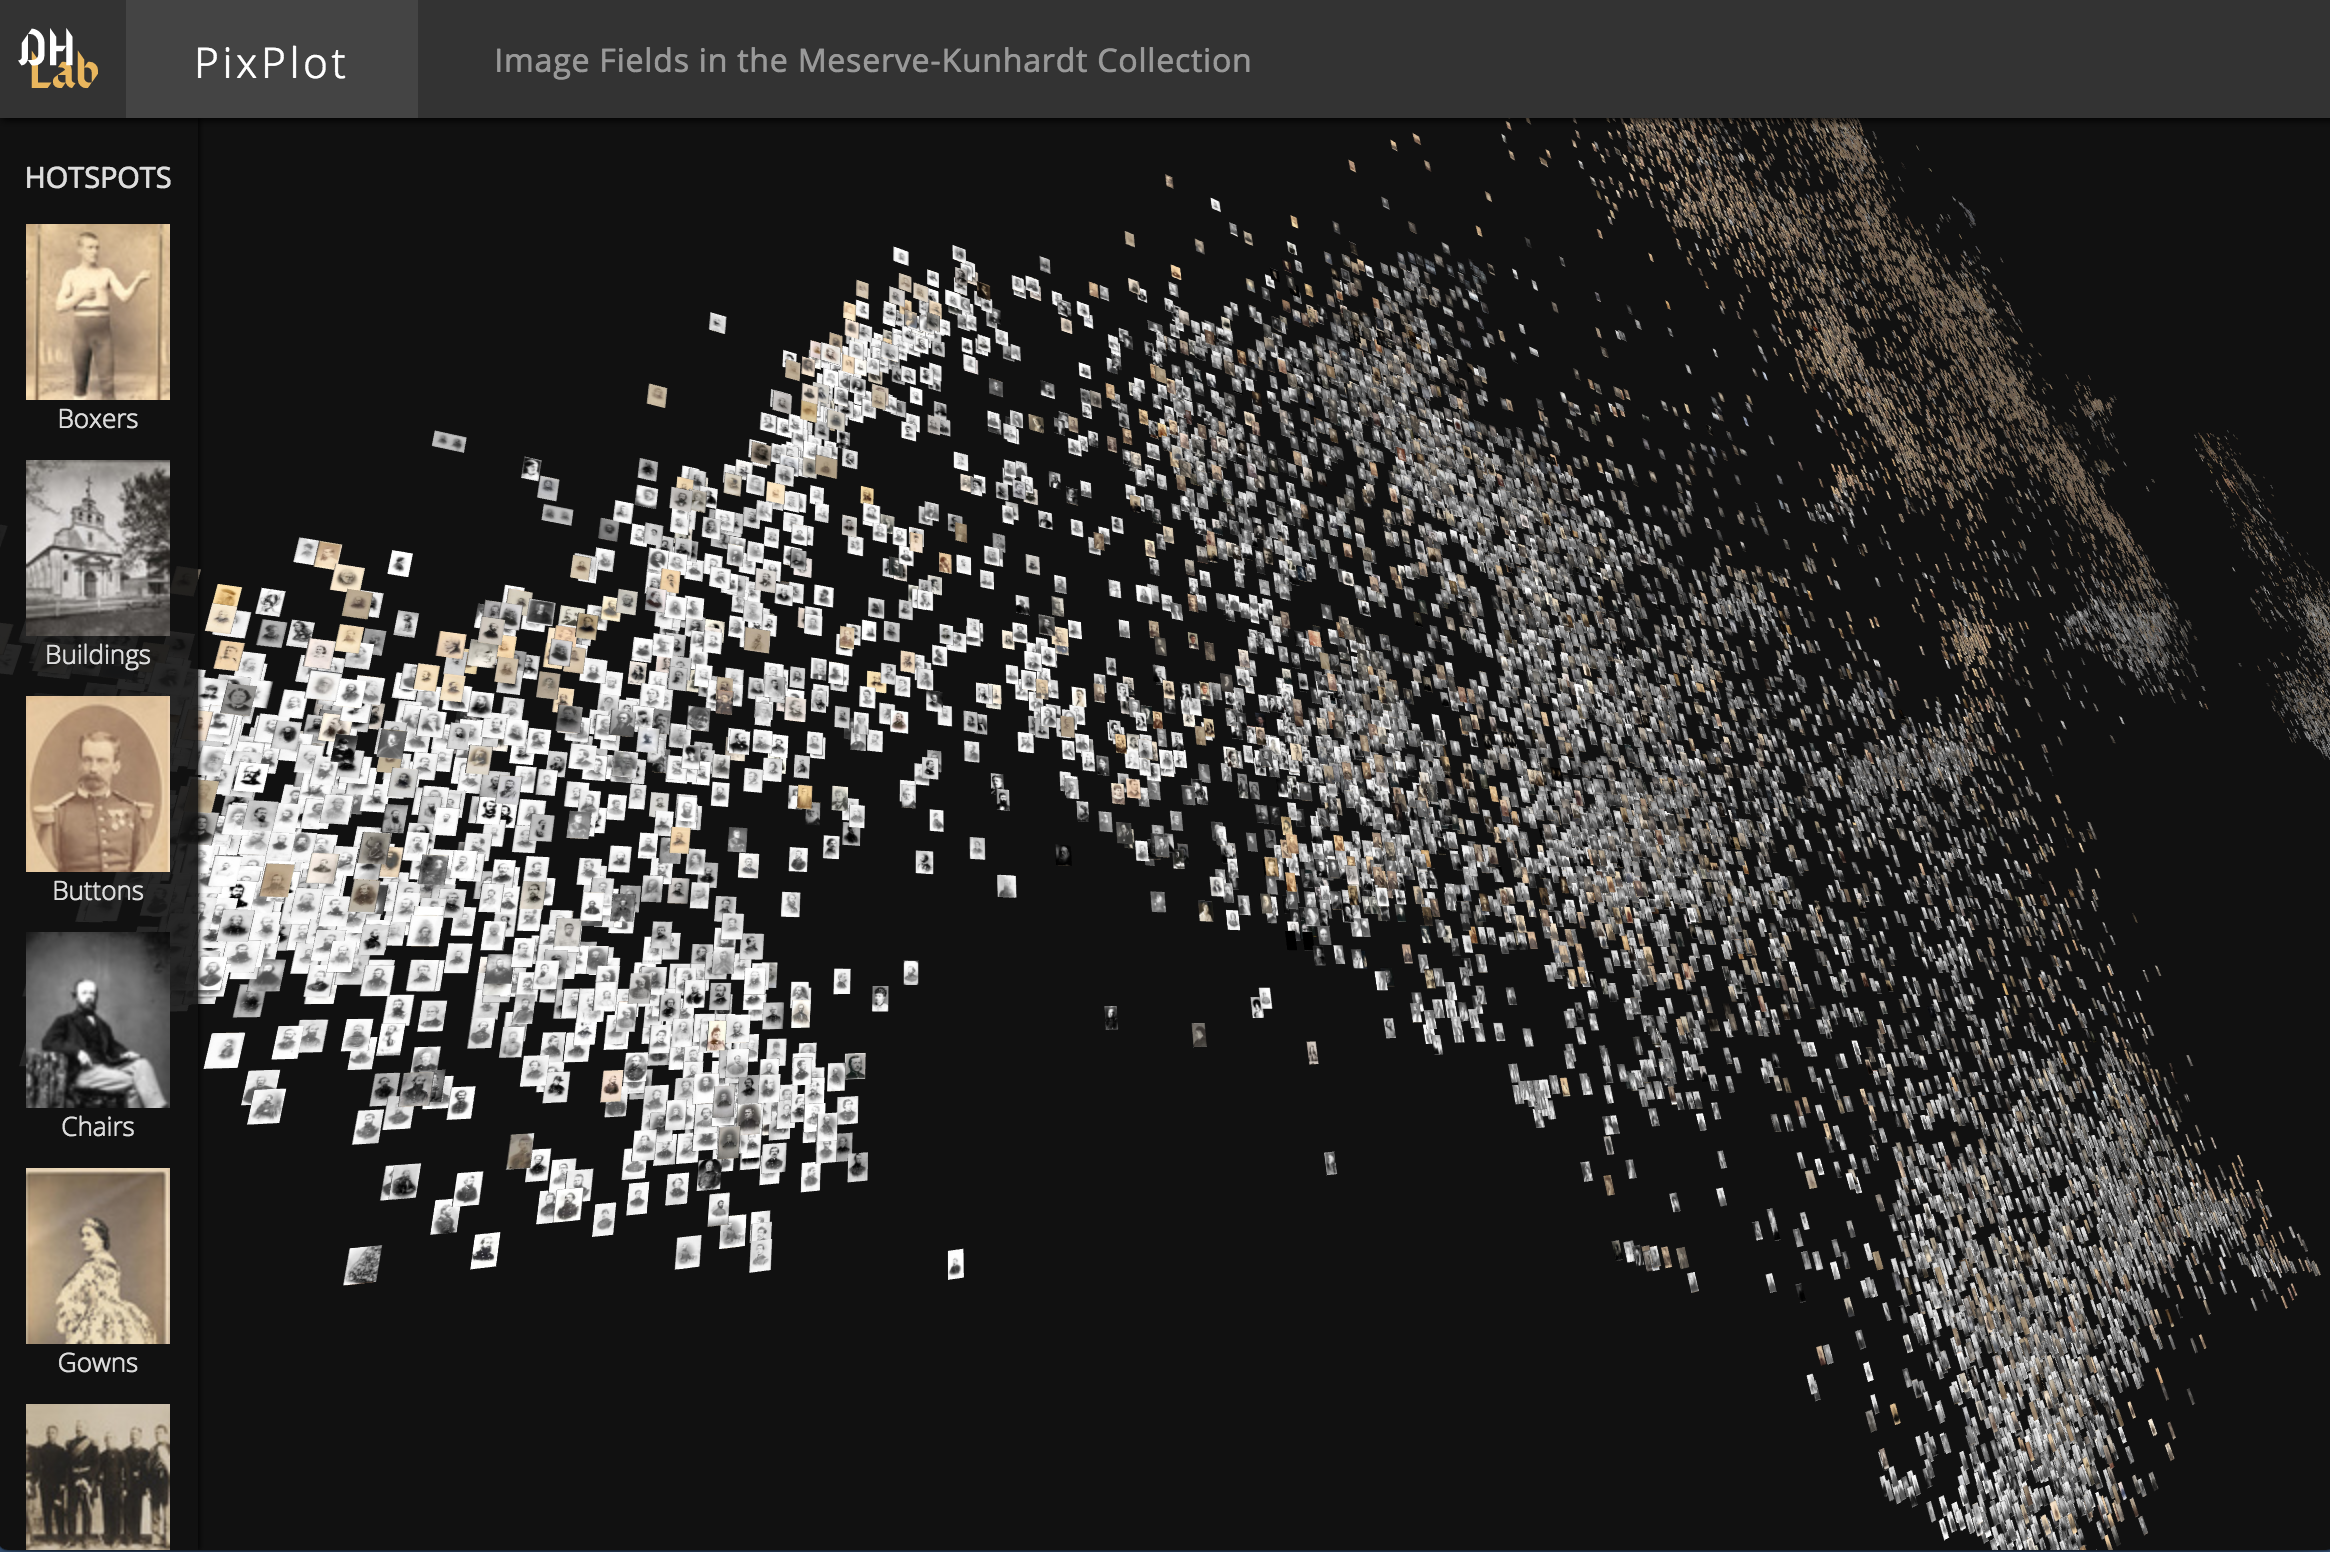
We use PixPlot a lot around here, both in our teaching and in projects like the BoneTrade project. It is an excellent tool for visualizing image similarity over thousands of images. It achieves this by measuring how each image perturbs a trained image network (in this case, Inception3). We end up with a vectorized representation of each image, and the distance between vectors can be measured, and visualized, as an indication of similarity: the less distance, the greater the similarity.
However, PixPlot (source code repository here) uses Python 3.7 and a series of packages that themselves could be out of date, or depend on other dependencies that could be out of date… and so on. Suffice it to say, Python 3.7 isn’t handy any more (the usual ways of installing it on your machine don’t have copies of it), and the tool is generally not usable (we did figure out how to use it within Google Colab, however, and there are cookbooks for different machines and set ups that you should probably check out before going any further with our materials here!). We decided to see if we could update PixPlot to work with Python 3.10. How hard could it be?
Reader, we were foolish.
We started by using ‘files-to-prompt‘ with ‘llm‘ to explore the code and its installation. Most of what PixPlot does is in a single script, but we’re learning how things go together, and being able to feed the script, the setup, the readme, and the web template code in all at once to Gemini helped us understand what was going on. This gave us a strategy for incremental things we could target, one bit at a time, seeing what happens if we do this… The upshot is, we now have Pixplot working with Python 3.10 on a mac mini m1. We haven’t fully tested it out on eg a windows machine, because we don’t have one handy at the moment. The most challenging part was diagnosing the dependencies and getting the right ones installed in the right order. There was also a difficult moment with rasterfairy, and we came up with a kludge that gets us around that. Proper coders will no doubt be horrified but… we had a problem, we were able to solve it. Isn’t that what universal computing was supposed to be about?
Then we wanted to go one further. Work by Arnold & Tilton on ‘distant viewing’ (see their book! it’s great!) showed that in some circumstances, measuring visual similarity also permits one to see how visual influences spread (in their case, in a collection of photos where the photographers; teacher/student relationships were known). Our repo therefore has a tool to take the output of PixPlot, and represent the images as a network according to n nearest neighbours. This can then be loaded into Gephi for further analysis; if you run PixPlot with its metadata flags, that metadata (and other metadata like thumbnail image names/locations) can be passed to the network too, which could then let you create networked image visualizations with things like Gephi’s sigma.js exporter plugin. If you put those images online, you could export from Gephi as gexf, where the path to the images is one of the attributes of the node, and then use the images themselves as nodes in something like Gephi-lite.
Anyway, we hope this is useful.

1000 historical images of Oslo, represented as a visual similarity graph that perhaps can be taken to represent influence