Michael Carrier is an MA History with Digital Humanities Student, with a focus on archaeological research
Thomas Ashby
The Thomas Ashby photographic archive is now in the public domain. Ashby was the first student (and later, the third Director) of the British School at Rome, and pioneered landscape archaeology in Italy through a number of ground breaking topographic studies. Among his many resources, he has left behind a series of maps of the Ostia region, which include his own notes in the margins and reflect the geomorphology of the year 1910.
I wanted to extract Ashby’s hand-written annotations from these maps, since they are in a very real sense the primary archaeological data for understanding the evolution of the region (which has been greatly modified over the last century). However, the content exists only as images, making them inaccessible to standard OCR used by programs like Adobe. In this blog post, I will explain how I managed to not only extract texts from these image-based maps but also reintegrate them back onto the maps in an easily readable, selectable text format. These maps were made available to us for study courtesy of the staff at the Library at the British School at Rome and Archaeological Officer Stephen Kay.
My experiment builds on research by previous XLab members Chantal Brousseau and Jeff Blackadar. I made use of the yolov7model computer vision model pre-trained by Brousseau from her work in “Metadata in The Margins” and Blackadar’s clearly explained tutorial for using Microsoft Azure for handwritten text transcription.
The first step involves processing the map images. In Brousseau’s project, she custom trained a version of YOLOv7 (an object detection computer vision model) to identify hand written texts in the margins of printed books. Brousseau’s model is here. Alternatively, I could have started from scratch and made my own training dataset using Brousseau’s ‘Rocket Annotator‘ and then her training scripts, which I’d then feed into the vision detection scripts (Brousseau’s annotation app is a refactored version of the VIA image annotation app). The image below shows what the process of using the app looks like:
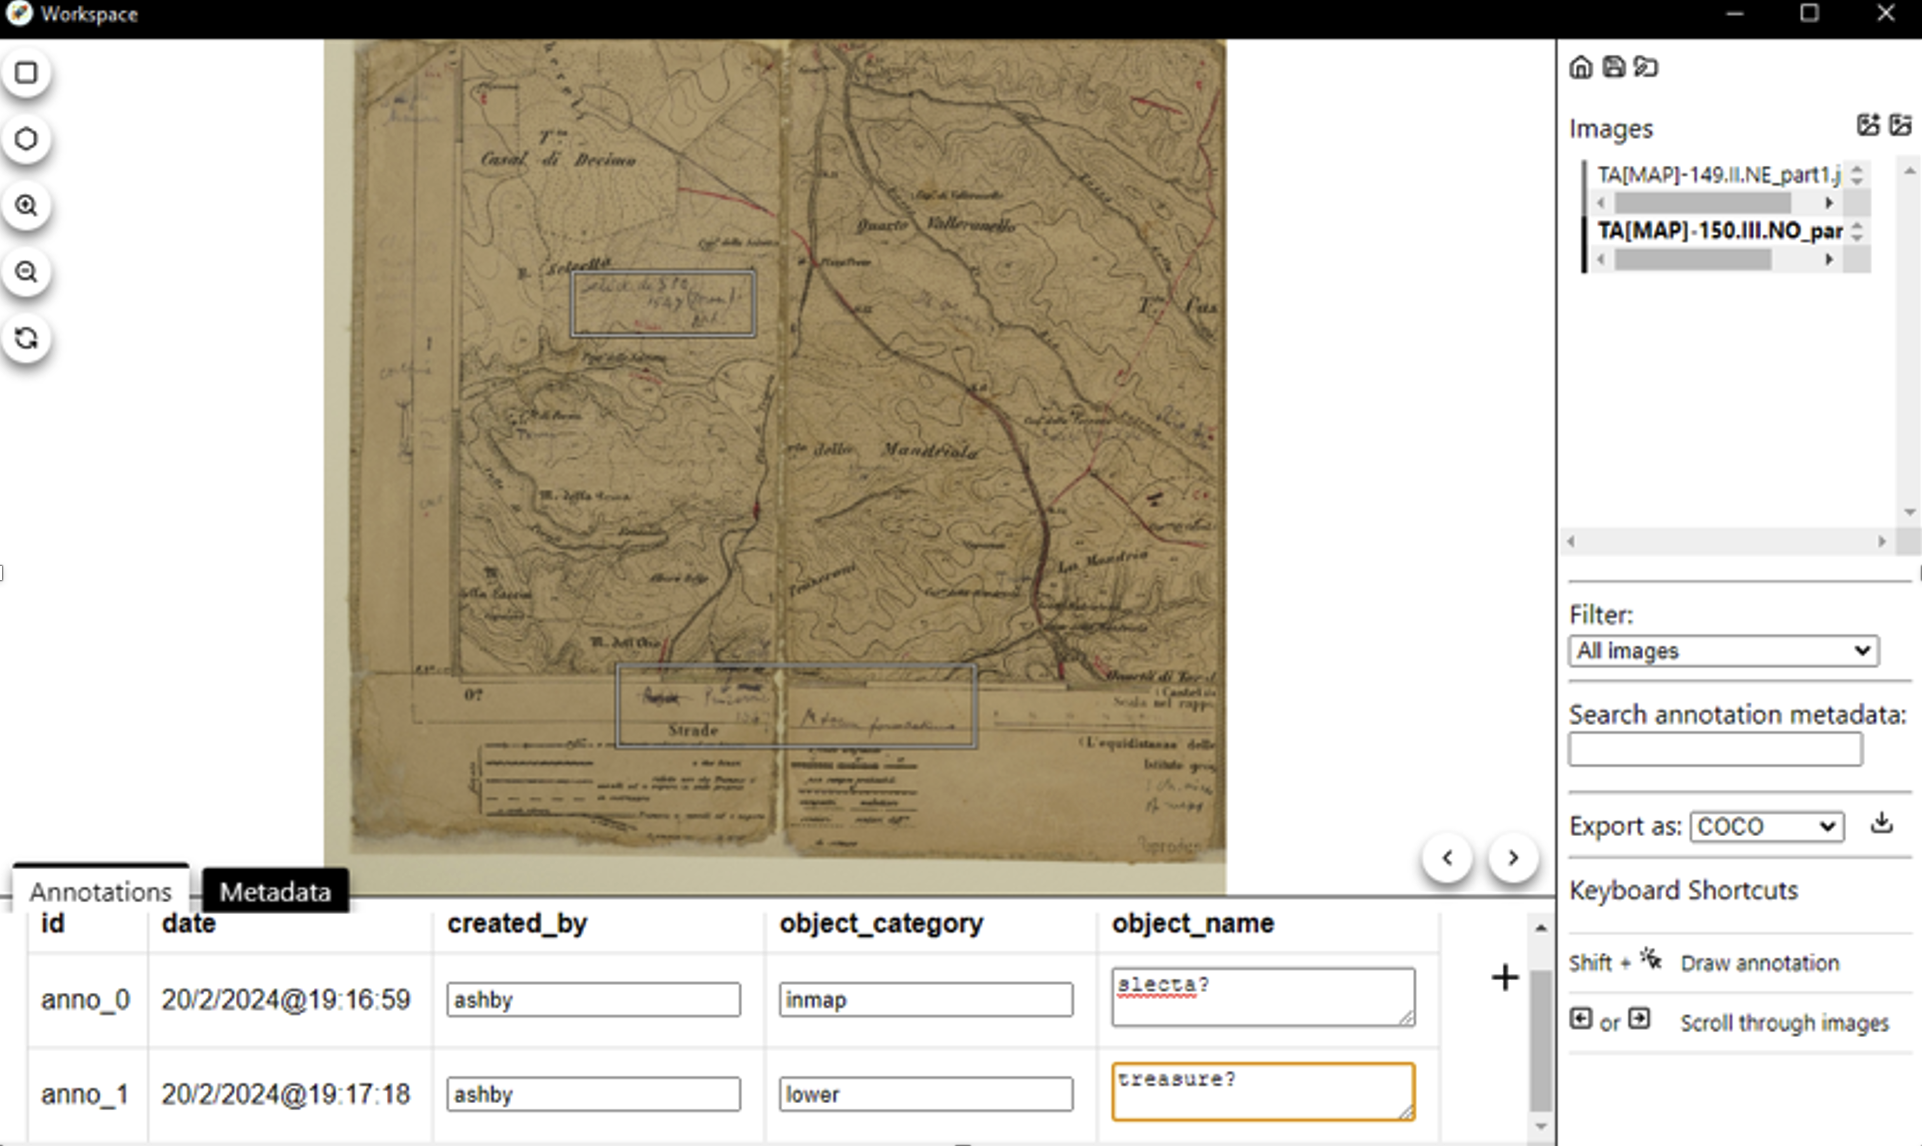
A screenshot of the Rocket Annotator in action with one of Ashby’s personal maps.
Happily, that wasn’t really necessary since Brousseau’s model seemed to pick up very nearly everything that I spotted by eye. In the illustration above, you can see a detail of one of Ashby’s maps with his handwriting surrounded by bounding boxes.
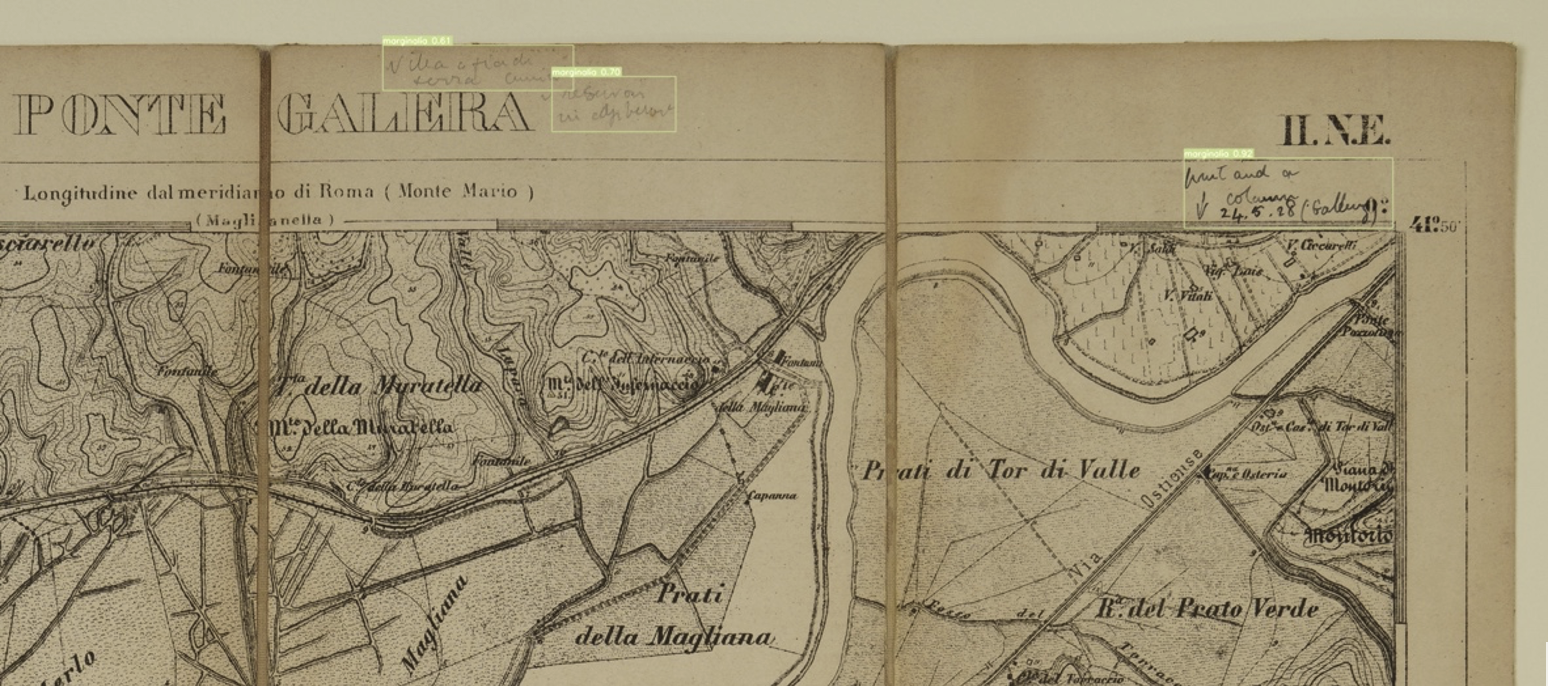
A detail from Ashby’s copy of the Ponte Galera map sheet, with handwritten annotations correctly located
After running the text identification model on the images, I have all the excerpts boxed so it is easy to find them. I am also able to crop them out and make an archive list of all of Ashby’s annotations. Unfortunately, it was still very difficult for me to read the handwritten 100-year-old cursive. I wanted a way to convert the handwriting into plain text. Adobe was not able to OCR the maps themselves. I used Blackadar’s python script which uses handwriting recognition models provided via the Microsoft Azure computing service. The output gives the text per line along with the coordinates of its boundaries. Reading this output file gave me the raw data of the handwritten text, but without the context of its positioning on the map.
I devised my own script to marry the plaintext transcription to its position on the map. This involved turning the original images into pdfs that matched the original dimensions. Then my python script recreates the boundary boxes (from Brousseau’s model) and places the plain text (from Blackadar’s script) into these boxes.

Part of my script.
The script would also measure the height of the boundary boxes and scale the text size accordingly (thus reflecting Ashby’s own emphasis; this is the kind of thing that gets lost in translation when using Microsoft azure to transcribe).

Part of the next script.
With those recreated pages, I used another python script to make the opacity of the pages to 100% and overlay them on top of the pdf versions of the map. This way, there is selectable text. I know the image below just looks like an empty page, but trust me, the invisible text is there!

Now I have Ashby’s maps as pdfs with a plain text layer corresponding to, and transcribing, his original annotations.
Thanks to the Brousseau’s pretrained model, I now have a list of all the handwritten inscriptions and their locations archived. And thanks to Blackadar’s article, I learned how to get my own transcriptions from handwritten text. I plan to use these two tools in my thesis research for any image that has text on them, along with the python script I used to make a pretend OCR pdf. Having Ashby’s primary analytical data searchable like this promises to give me new insight into his work as an archaeologist, in a way that hasn’t really been attempted yet. (For more on Ashby’s scholarship, and scholarship on Ashby, we can begin with this Google Scholar search for ‘Thomas Ashby Rome’).
I’m just cleaning up my scripts for sharing, and they will be made available soon.