Real-time IoT Data Visualization on the sWall
The Smart Wall (sWall) is a collection of four large interactive touchscreens located on the 4th floor of the Mackenzie building. It currently features videos, animations, demos, games and other interactive activities which are accessible by everyone.
The goal of this project is to upgrade the sWall so as to present in real-time data collected from different sensor nodes around Carleton University’s campus. The data will be displayed in an interactive manner so the end-user can access, display, and manipulate the targeted IoT data.
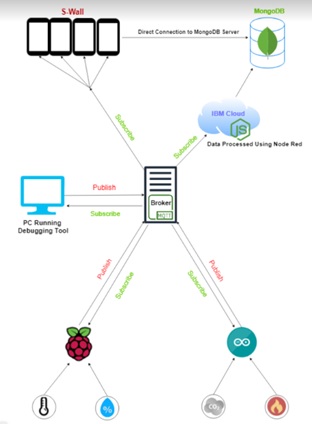
The IoT sensor nodes deliver time-stamped packages which contain data about their environment, including humidity and temperature. These packages are transmitted through the MQTT (Message Queuing Telemetry Transport) protocol and the captured data is stored in MongoDB, a distributed cross-platform document-based database. The data is then analyzed and displayed in a C# WPF (Windows Presentation Foundation) application in visual studio with live meters and charts displaying the last 24 hours worth of data.