Carleton’s LMS, D2L Brightspace, offers multiple different ways of gaining insight into your course’s performance using student behavior data that is collected by the Brightspace software. These Brightspace Core Analytics are extremely powerful and can be used to gain insight into many aspects of your course design and levels of student engagement.
Note that Brightspace does not collect data from third party tools and LTIs. If you wish to obtain student data from supported tools, use the analytics capabilities of the individual tools. For more information, see the section on Supported Tools with learning analytics.
Brightspace Core Analytics Tools
The table below lists the Brightspace Core Analytics tools supported at Carleton. Click on each tool’s name to see a brief overview and screenshot of the tool being used. You can find this list of tool descriptions below the table.
| Brightspace Tool | Use Cases | Learning Data Collected |
| Discussions Stats | Gather information on student engagement and disengagement in a course |
|
| Quiz Stats | To perform detailed analysis on quiz structure and question engagement, and inform future Quiz design. |
|
| Intelligent Agents Reports |
Many potential uses cases including to build reports that satisfy a combination of the agent Criteria Fields and release conditions, such as completion or non completion of work, or login details. For a complete list of use cases, visit our support site Using Intelligent Agents to Create Data Reports. |
Use Intelligent Agents to create Data reports on:
|
| Class Progress | To identify students at risk of low performance,or at promise of improved performance. | View detailed student progress reports for:
|
| Grade Statistics and Event Logs | To observe trends in class grade performance. |
|
| Course Content Reports | To view and export overall content viewing statistics in a course, as well as viewing statistics for individual students and content modules. |
|
| Rubric Statistics | To observe trends of how student performance corresponded to specific rubric criteria . |
|
Core Analytics Tools Overview
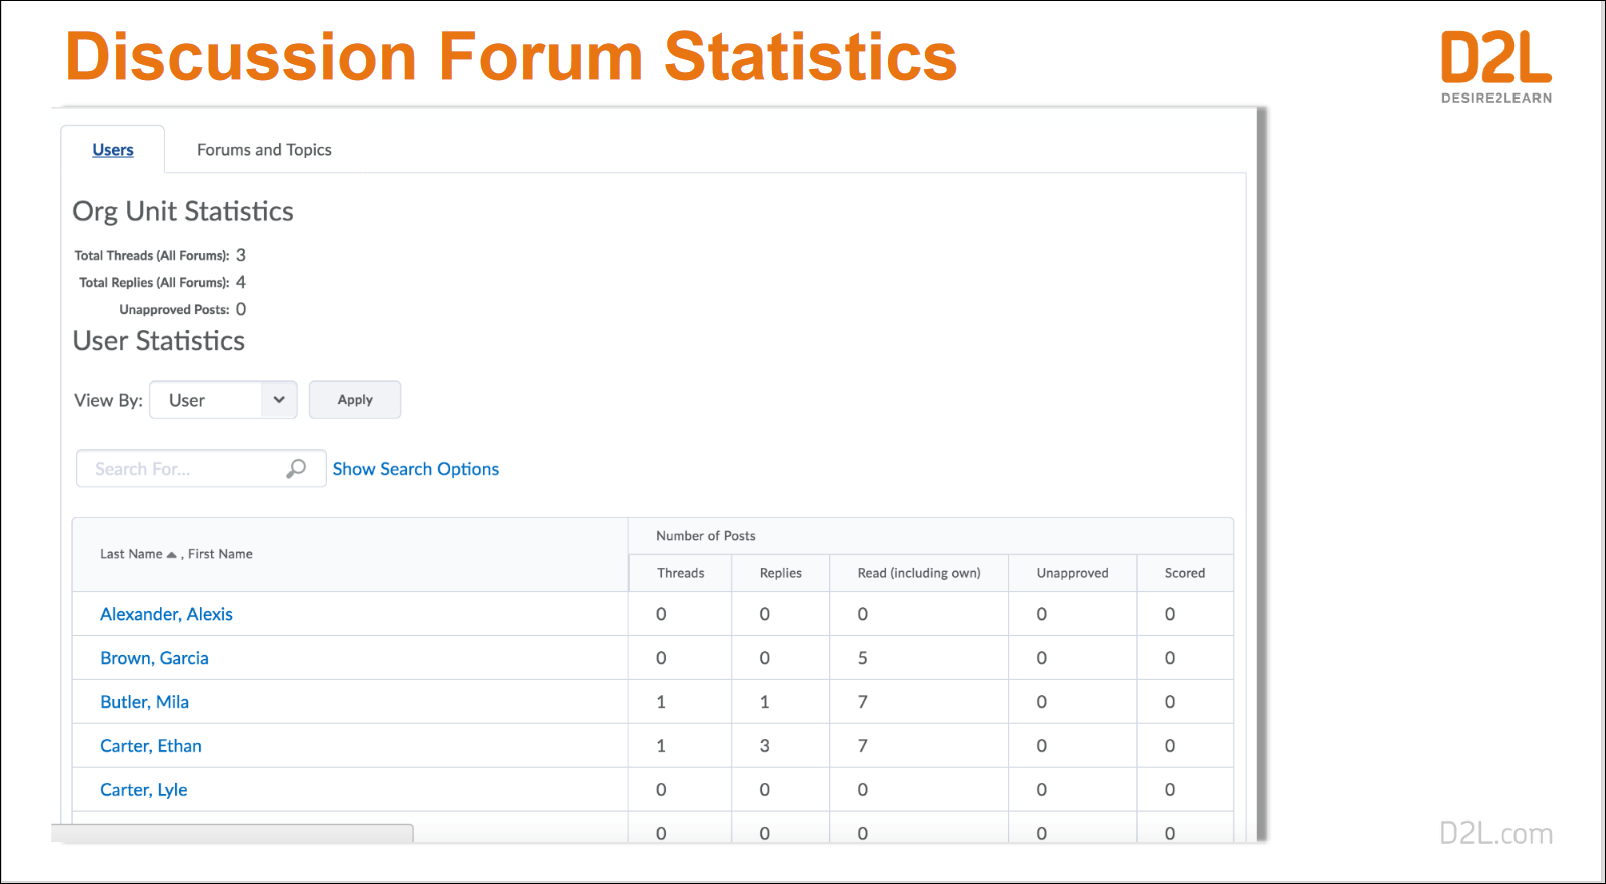
Discussion Statistics
Click to see an Image of the Discussion Statistics
The Discussion tool in Brightspace includes a statistics feature that provides an overview of discussion activity in your course. Discussion statistics are useful for measuring student engagement and tracking participation.
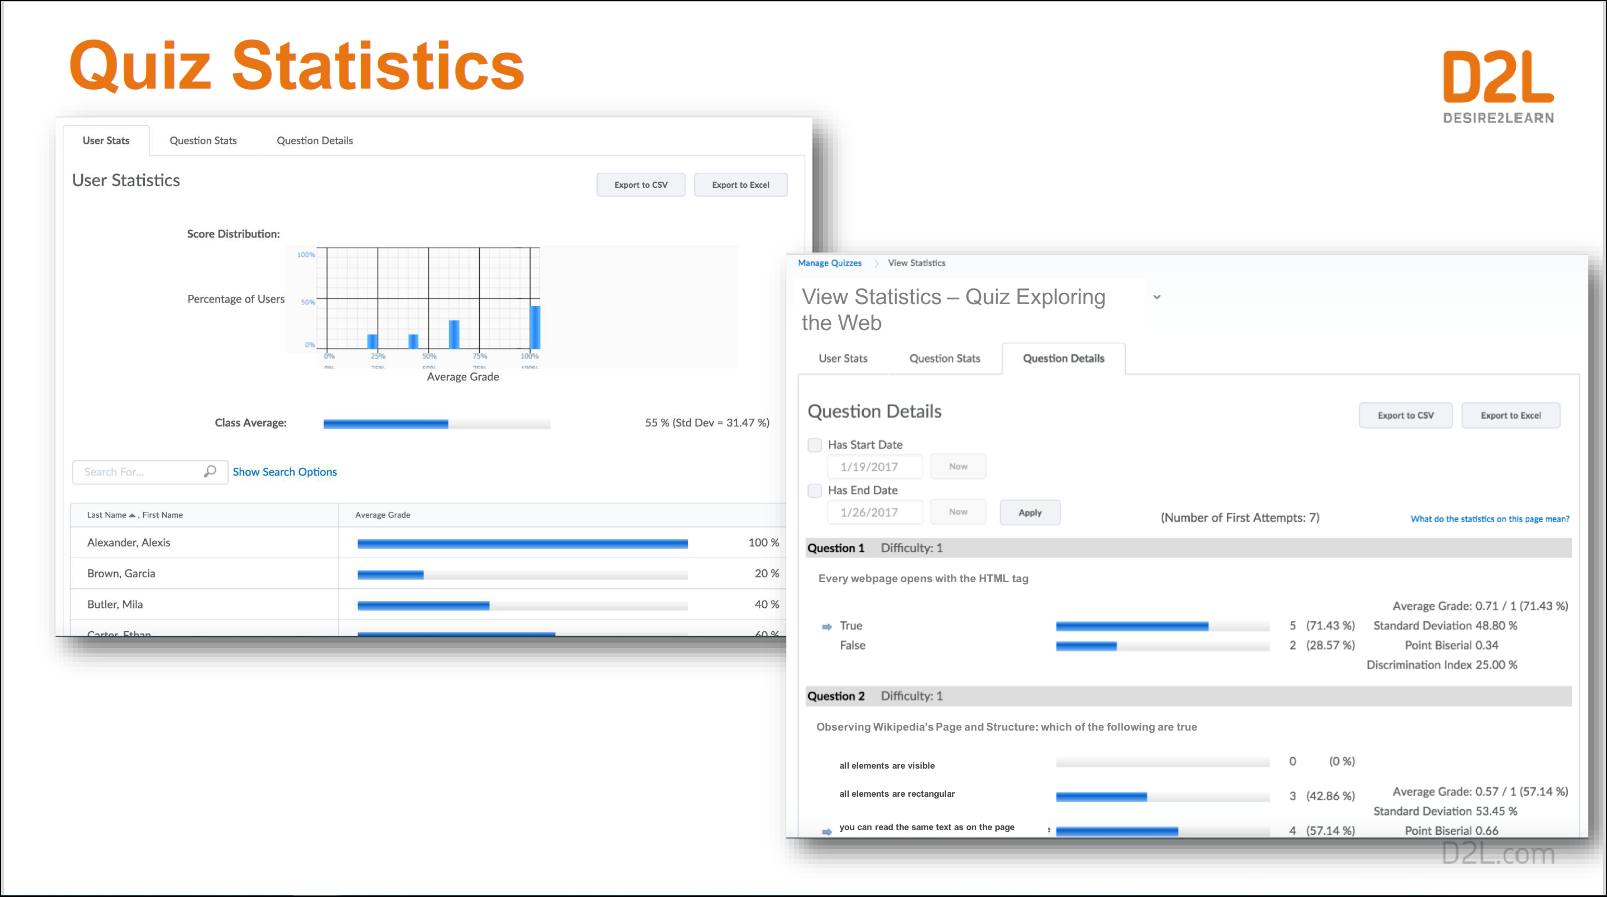
Quiz Statistics
Click to see an image of Quiz Statistics
Quiz Statistics provide information on how students performed on a D2L Brightspace quiz and a detailed analysis of each question. Quiz data can also be exported to an excel or CSV file.
Intelligent Agents Reports
Intelligent Agents (IAs) are communication tools that can send email notifications to instructors and students when particular tasks/actions are completed in a course. IA’s also have a automated data reporting functionality instructors may use to compile learning data reports.
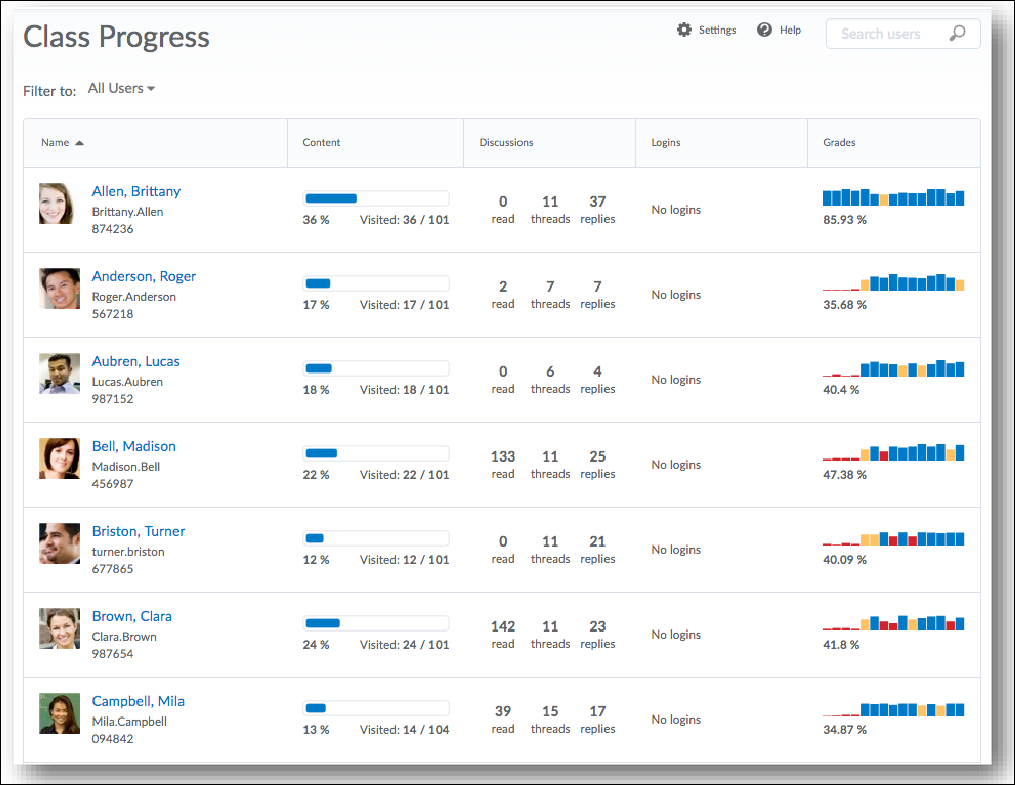
Class progress
Click to see an Image of the Class Progress Dashboard
The Class Progress tool allows instructors to review student performance using any four chosen performance indicators from a selection of nine.
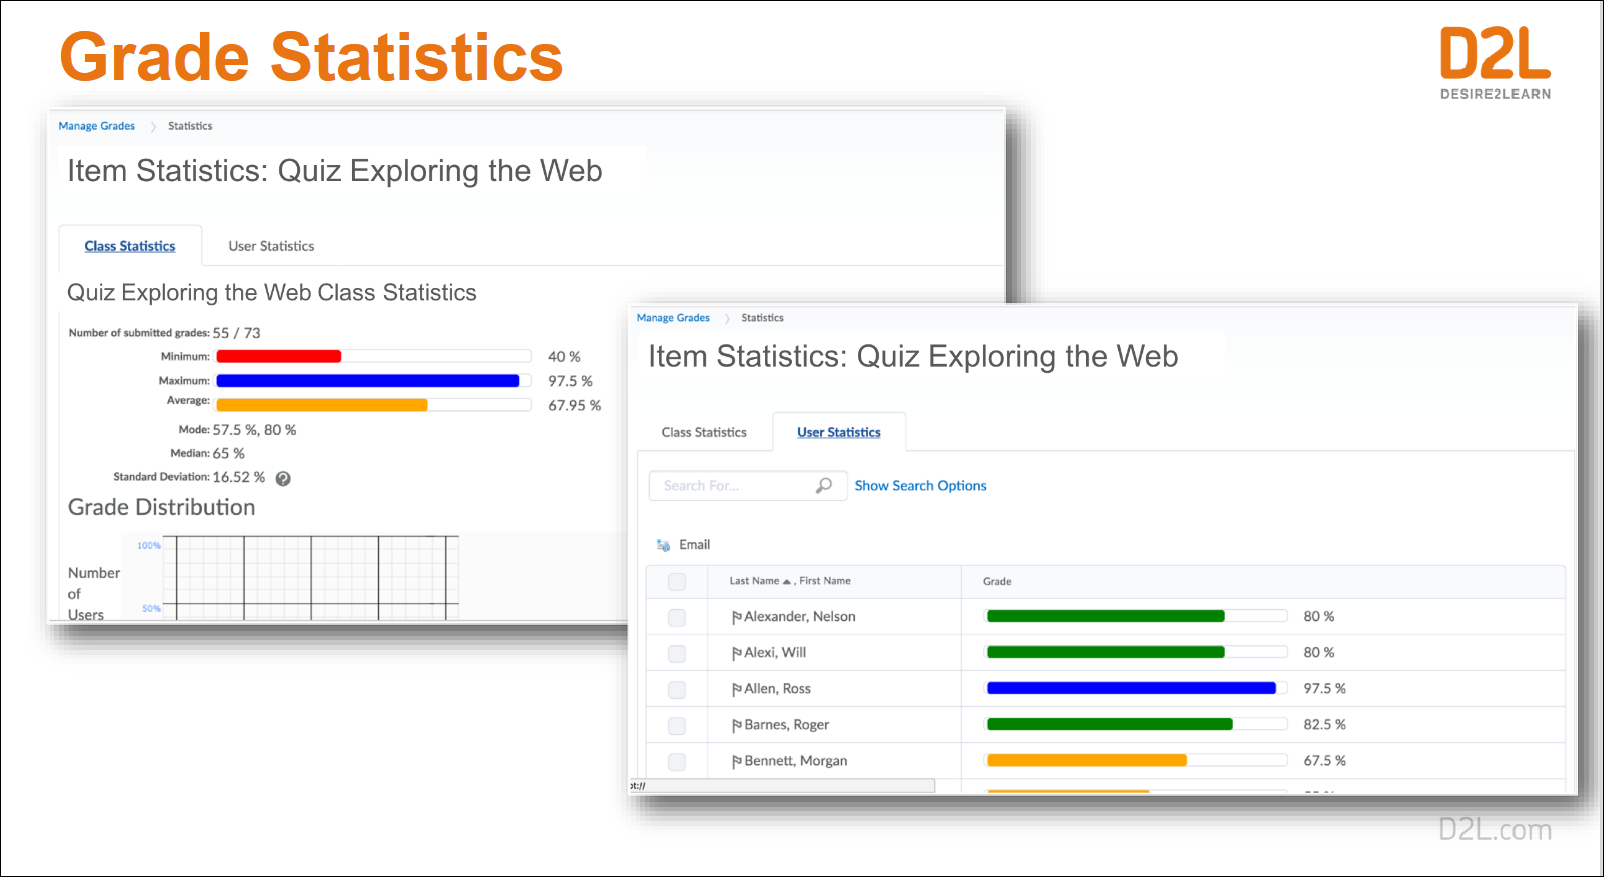
Grade Statistics and Event Logs
Click to see an Image of Grade Statistics
Brightspace core analytics includes a statistics tool for grade items and event logs. Once an assessment in D2L Brightspace has been completed and graded, instructors are able to access aggregate and individual statistics related to the grades. The D2L Brightspace Grade Book also has an Overall Event Log and a Grade Item Event Log.
Course Content Reports
Course Content reports include the number of students who visited course modules/topics and the average time students spent viewing course content. You have the option to view overall course content statistics as well as statistics for individual students or modules.
Rubric Statistics
Brightspace comes equipped with the ability to build rubrics right into the LMS’s evaluations. Once you have created a rubric and used it to provide students with feedback, you are able to examine associated data. These Rubric Statistics provide granular statistics for the criteria outlined in the rubric (Criteria Statistics). If you are looking for aggregate information related to student’s grades, you should look at Grade Statistics instead.
Support
For consultations and help implementing Brightspace Core Analytics into your course, contact the Teaching and Learning Services team through the TLS Support Portal.