Quiz Statistics provide information on how students performed on a D2L Brightspace quiz and a detailed analysis of each question. Quiz data can be exported to an excel or CSV file. Once students have completed a quiz in Brightspace, instructors can view and export the following statistics:
- User Stats – Statistics for individual users.
- Question Stats – Statistics for each quiz question.
- Question Details – Detailed analysis of each question.
PLEASE NOTE:
|
Viewing Quiz Statistics
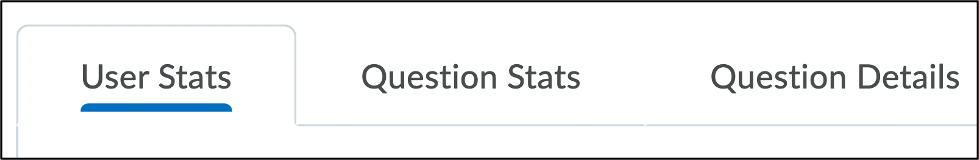
The Quiz Statistics page has three tabs: User Stats, Question Stats, Question Details. You can view and/or export user or question statistics from each of these tabs. See D2L’s View Quiz Statistics documentation for more information about quiz statistics in Brightspace.
Accessing Quiz Statistics
- Log into Brightspace with your MyCarletonOne credentials.
- On the Brightspace homepage, locate your course in one of the following ways:
- Select the course tile under the My Courses widget.
- Select the Course Selector Grid
 and select the course from the drop-down menu. If you are enrolled in more than 20 courses, you can search for the course name using the search bar.
- In the navbar, select Tools.

- Select Quizzes from the drop-down menu. You will be taken to your Manage Quizzes page.
- Select the Statistics tab.

- In the Current Quizzes table, select the Quiz you want to access statistics for.
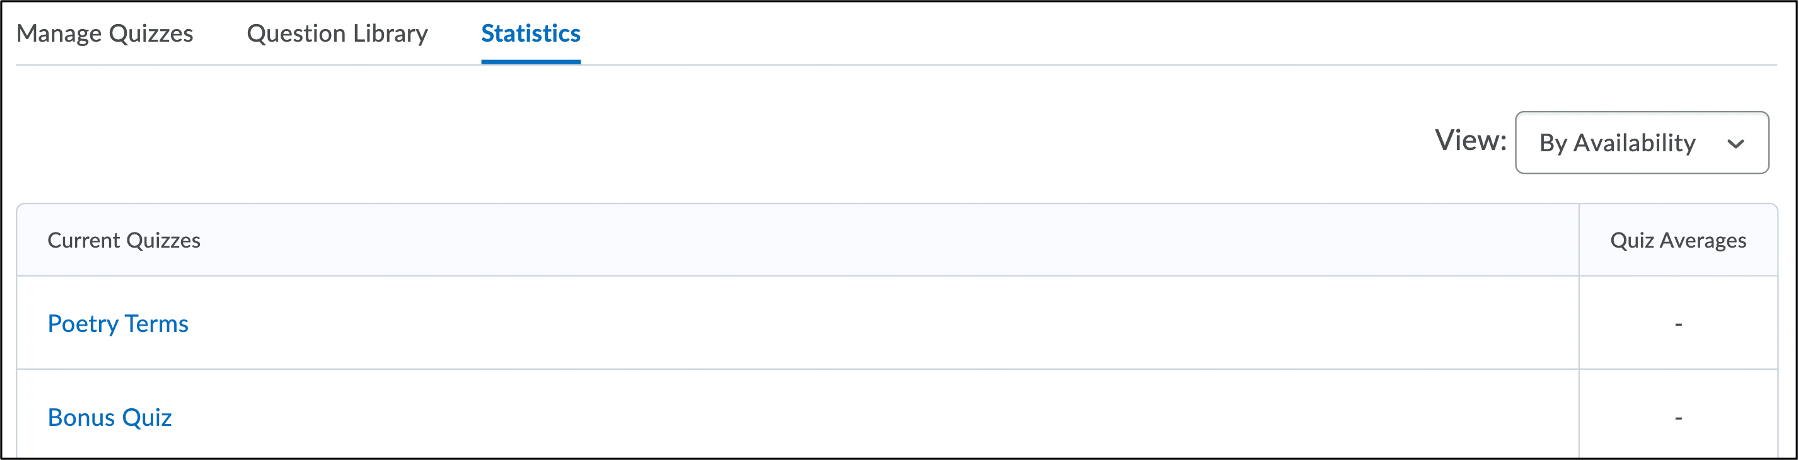
- You will be taken to the User Stats tab of the View Statistics page for your selected quiz. You can use the following three tabs at the top of the page to view the statistics for each student or quiz question:
- User Stats – View statistics for individual users.
- Question Stats – View statistics for each quiz question.
- Question Details – View a detailed analysis of each question.
Viewing User Stats
- Log into Brightspace with your MyCarletonOne credentials.
- On the Brightspace homepage, locate your course in one of the following ways:
- Select the course tile under the My Courses widget.
- Select the Course Selector Grid and select the course from the drop-down menu. If you are enrolled in more than 20 courses, you can search for the course name using the search bar.
- Locate your quiz in one of the following ways:
- In the navbar, select Tools and select Quizzes in the drop-down menu. Find your quiz on the Manage Quizzes page.
- In the navbar, select Content and select the module or submodule that holds your quiz.
- Select the arrow
 next to the quiz and select Statistics from the drop-down menu.

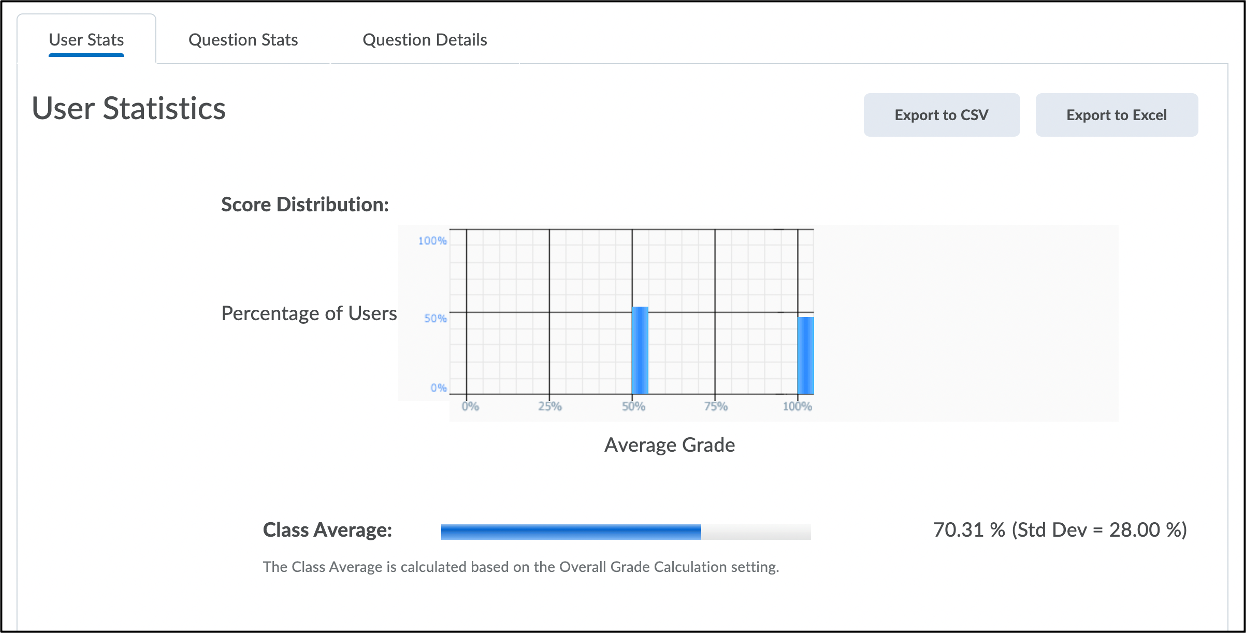
- You will be taken to the User Stats tab of the View Statistics page. From this tab, you can view the score distribution, class average, and the quiz grades for each student.
| NOTE: The quiz feedback must be published to view the class average and standard deviation. |
Viewing Question Stats
- Log into Brightspace with your MyCarletonOne credentials.
- On the Brightspace homepage, locate your course in one of the following ways:
- Select the course tile under the My Courses widget.
- Select the Course Selector Grid and select the course from the drop-down menu. If you are enrolled in more than 20 courses, you can search for the course name using the search bar.
- Locate your quiz in one of the following ways:
- In the navbar, select Tools and select Quizzes in the drop-down menu. Find your quiz on the Manage Quizzes page.
- In the navbar, select Content and select the module or submodule that holds your quiz.
- Select the arrow next to the quiz and select Statistics from the drop-down menu.
- You will be taken to the User Stats tab of the View Statistics page.
- Select the Questions Stats tab. From this tab, you can view the score distribution, average score, standard deviation, discrimination index, and point biserial for each question.
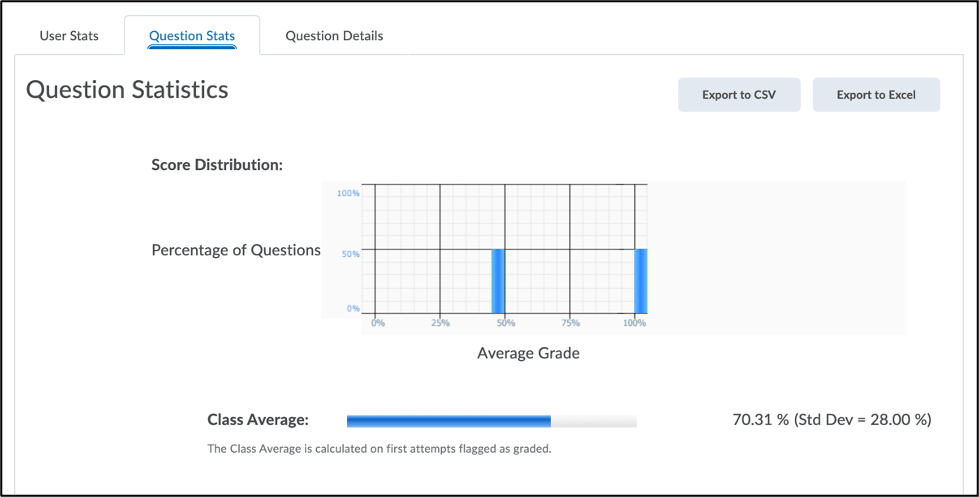
| NOTE: Question statistics are not computed for questions in a Question Pool. |
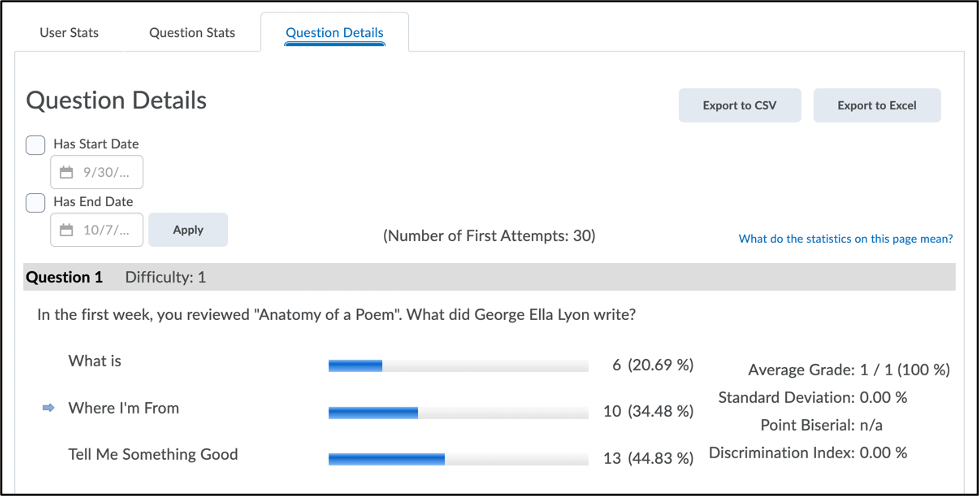
Viewing Question Details
- Log into Brightspace with your MyCarletonOne credentials.
- On the Brightspace homepage, locate your course in one of the following ways:
- Select the course tile under the My Courses widget.
- Select the Course Selector Grid and select the course from the drop-down menu. If you are enrolled in more than 20 courses, you can search for the course name using the search bar.
- Locate your quiz in one of the following ways:
- In the navbar, select Tools and select Quizzes in the drop-down menu. Find your quiz on the Manage Quizzes page.
- In the navbar, select Content and select the module or submodule that holds your quiz.
- Select the arrow next to the quiz and select Statistics from the drop-down menu.
- You will be taken to the User Stats tab of the View Statistics page.
- Select the Questions Details tab. From this tab, you can view a detailed analysis of each question, including the correct answer and the percentage of times each answer was chosen. You can also view the average grade, standard deviation, discrimination index, and point biserial for each question.
| NOTE: Question statistics are not computed for questions in a Question Pool. |
Viewing Class Attempt Logs
- Log into Brightspace with your MyCarletonOne credentials.
- On the Brightspace homepage, locate your course in one of the following ways:
- Select the course tile under the My Courses widget.
- Select the Course Selector Grid and select the course from the drop-down menu. If you are enrolled in more than 20 courses, you can search for the course name using the search bar.
- Locate your quiz in one of the following ways:
- In the navbar, select Tools and select Quizzes in the drop-down menu. Find your quiz on the Manage Quizzes page.
- In the navbar, select Content and select the module or submodule that holds your quiz.
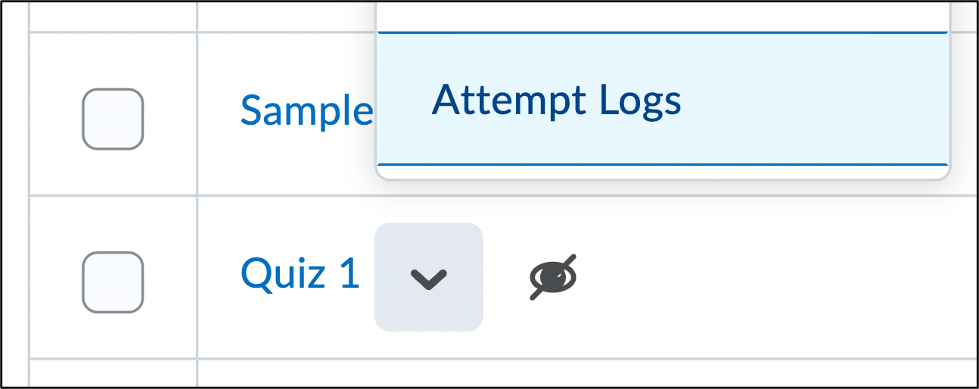
- Select the arrow next to the quiz and select Attempt Logs from the drop-down menu.
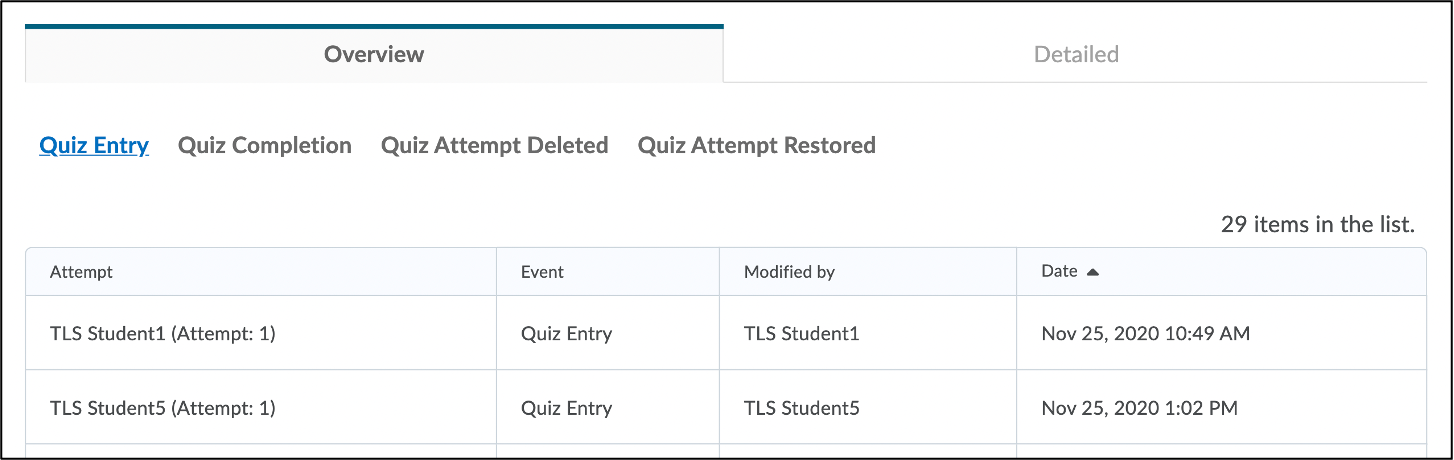
- You will be taken to the Overview tab of the Attempt Logs page page. From this tab, you can select one or more of the following links to sort the list:
- Quiz Entry – View when each student entered the quiz.
- Quiz Completion – View when each student completed the quiz.
- Quiz Attempt Deleted – View who deleted a quiz attempt.
- Quiz Attempt Restored – View who restored a quiz attempt.
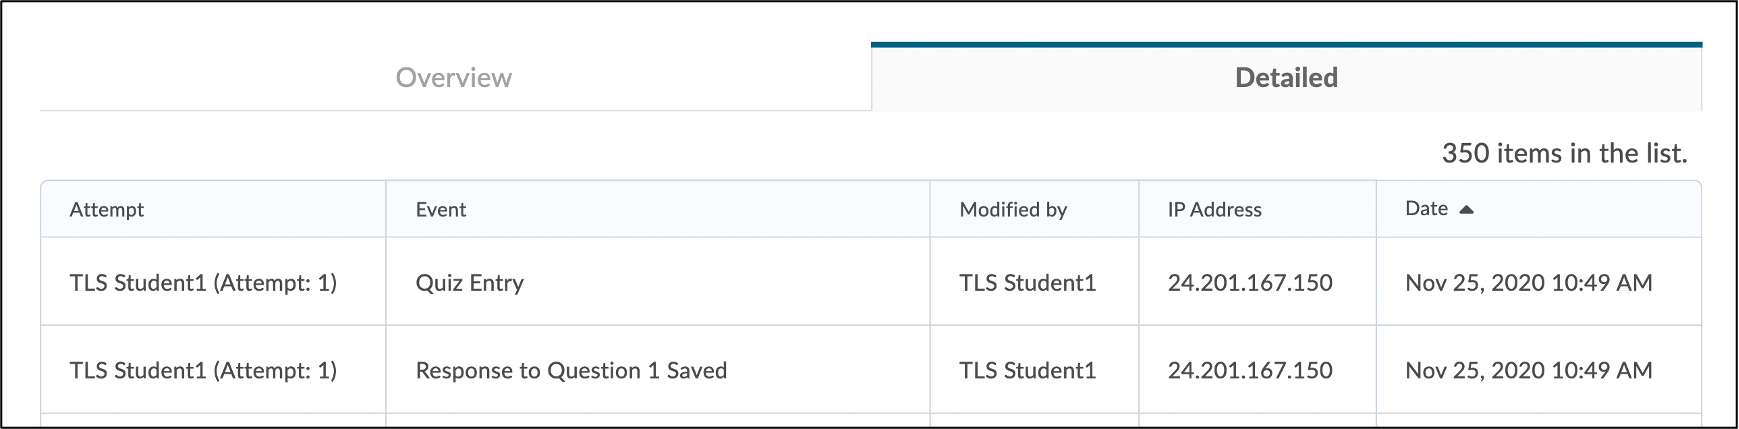
- Under the Detailed tab, you can view a detailed overview of attempt logs, including student IP addresses.
Viewing Individual Attempt Logs
- Log into Brightspace with your MyCarletonOne credentials.
- On the Brightspace homepage, locate your course in one of the following ways:
- Select the course tile under the My Courses widget.
- Select the Course Selector Grid and select the course from the drop-down menu. If you are enrolled in more than 20 courses, you can search for the course name using the search bar.
- Locate your quiz in one of the following ways:
- In the navbar, select Tools and select Quizzes in the drop-down menu. Find your quiz on the Manage Quizzes page.
- In the navbar, select Content and select the module or submodule that holds your quiz.
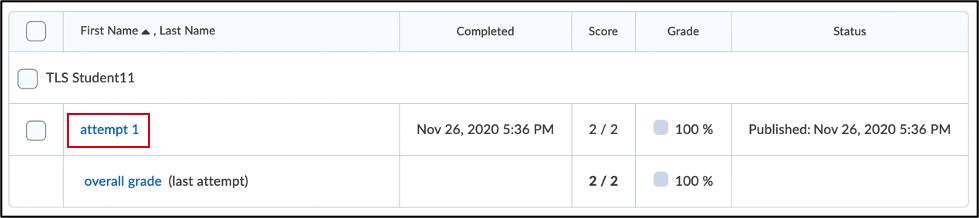
- Select the arrow next to the quiz and select Grade from the drop-down menu.
- Select the attempt # below a student’s name.
- Select Quizzes Event Log.
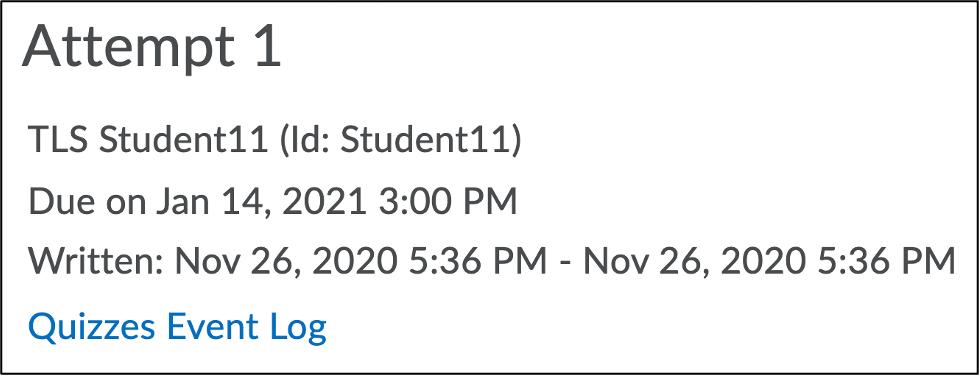
- A pop-up window will open displaying the Quiz Details and Event Log.
- Select Close to exit the window.
Exporting Quiz Statistics
You can export your quiz statistics reports to a CSV or Excel file for data analysis. The CSV file contains all pertinent information on the quiz so that you can query, sort, and evaluate the data without being logged into Brightspace.
| NOTE: The system exports the statistics only from the tab you are currently viewing. |
To export quiz statistics:
- Follow steps 1-5 above to access your Quiz Statistics page.
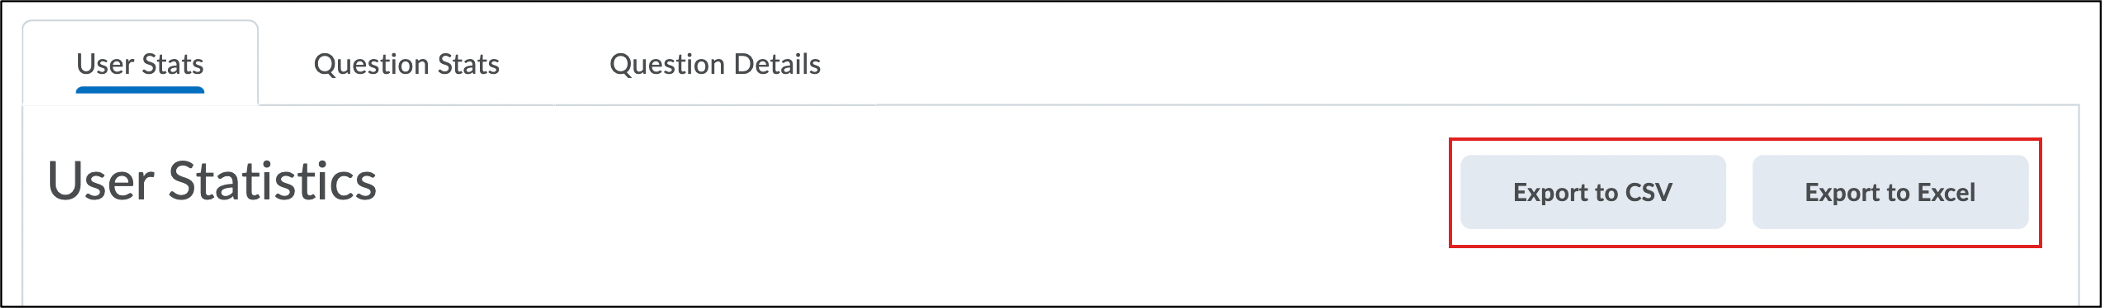
- Select one of the three tabs (User Stats, Question Stats, or Question Details) at the top of the Quiz Statistics page. For more information about each tab, see Viewing Quiz Statistics.
- Select Export to CSV or Export to Excel.
You will now be able to open the exported excel or .csv file on your computer. Where you access the downloaded file is dependent on your Operating System and browser.
Data exported for Question Details
| Question Type | What is exported? |
| Multiple Choice | All of the possible answers and the number of responses for each answer. |
| True or False | All of the possible answers and the number of responses for each answer. |
| Long Answer | All of the responses provided listed on separate rows. |
| Short Answer | The correct answer for each blank and an additional row for all other answers, and the number of responses for the correct answer versus other answers. |
| Multi-Short Answer | The correct answers for each blank and an additional row for all other answers, and the number of responses for the correct answer versus other answers. |
| Fill in the Blanks | The correct answers and an additional row for other answers, and the number of responses for the correct answer versus other answers. |
| Multi-Select | All of the possible answers and the number of responses for each answer. |
| Matching | All of the possible matches and the number of responses for each match. |
| Ordering | All of the answers in the order match and the number of responses for each match. |
| Arithmetic | Questions are broken down by results and units. Also, lists which users had both results and units correct, only results correct, only units correct, and neither correct. |
| Significant Figures | Questions are broken down by results and units. Also, lists which users had both results and units correct, both results and units correct as well as significant figures, only results correct, only results and significant figures correct, only units correct, and neither results or units correct. |
Quiz Statistics Key Terms
Standard deviation (SD): How much variation there was in the scores for this question or a measure of the spread of scores about the mean and hence the extent to which the question might discriminate. If F is very high or very low it is impossible for the spread to be large. Note however that a good SD does not automatically ensure good discrimination.
Discrimination index: This is the correlation between the weighted scores on the question and those on the rest of the test. It indicates how effective the question is at sorting out able students from those who are less able (students who score highly on this question are the same students who score highly on the whole quiz).
Point Biserial: Point Biserial calculates any possible correlation between the question score and the total quiz score. It measures the strength of the correlation between the two values, and shows either a positive or a negative relationship ranging from -1.00-+1.00.
Was this page helpful?
6 people found this useful
Still need help? Contact us