COLDASS
The Cryospheric Observations Longterm Database And Storage System (COLDASS) stores permafrost data, makes them accessible for analysis and simulation, and serves as a prototype working towards large-scale and interoperable permafrost data handling. It can accommodate a broad variety of data such as temperature, site descriptions, geotechnical and geochemical data as well as maintenance records. The Northwest Territories Geological Survey (NTGS) is the key collaborator and supporter of this project.
For more information about the database or if you are interested in storing your permafrost data with us, please email stephan.gruber@carleton.ca or nick.brown@carleton.ca.
The data is stored and organized in two forms: (1) raw in campaign-specific directories on a network drive and (2) structured in a database. To allow traceability between field work and the database, raw data includes scanned field forms, photographs and logger readout files. This data is then organized, commented, synthesized and imported into the database using a web interface or a customized R-package. The database is implemented in PostgreSQL and run at Carleton University’s Geomatics and Cartographic Research Centre (GCRC); the network drive is hosted by ITS/RCS at Carleton University.
COLDASS currently includes temperature data from near-surface loggers, air temperature sensors and borehole thermistor chains, as well as site descriptive data related to vegetation, soil and drainage. A first set of observations from Lac de Gras has been made publicly available via Nordicana-D.
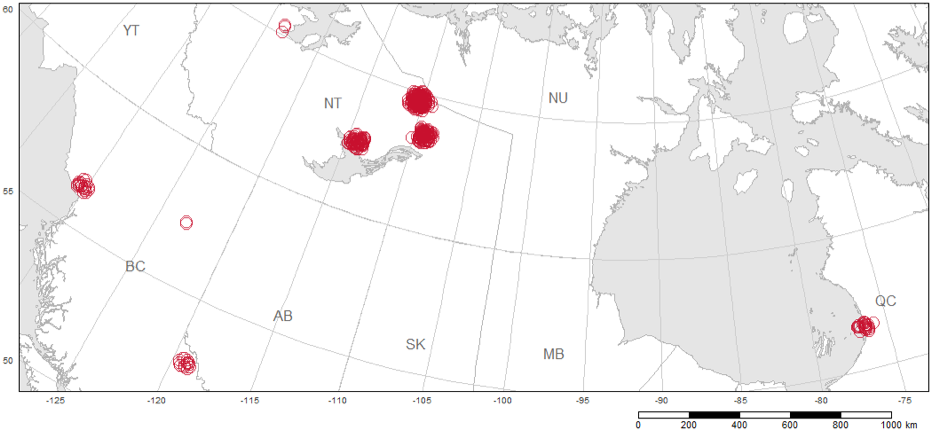
Permafrost monitoring sites established across Canada indicated by red circles. The largest clusters of sites are present in Yellowknife, KDI and Lac de Gras, NWT.
Uses, tools and access
The network drive and database are primarily used by students and postdocs in PERIL at Carleton University. The drive is organized by field campaign with subfolders for individual sites. It holds all data collected in the field and therefore serves as a backup and reference to the database. This is important as some data is lost or interpreted when transferring to the database. This transfer can be done manually through a web interface or through the PermafrostDB R package built by PERIL. PermafrostDB contains tools for data import, analysis, visualization and export. Summary statistics can be quickly calculated and time series plotted for devices of all sites.
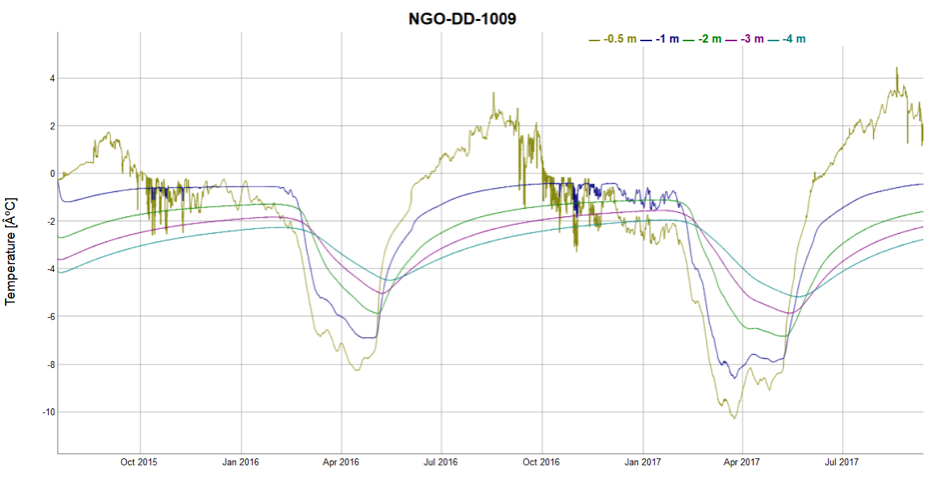
Example time series plot from PermafrostDB of a thermistor chain from site NGO-DD-1009 near Lac de Gras and Ekati Mine, NWT.
To increase data usability, PermafrostDB has the capability to export the data into a variety of standard forms. These include a CSV or XLSX format that approximates the Northwest Territories Geological Survey (NTGS) XLSX file standard for ground temperature data, a CSV that is formatted in the same way as GTN-P database time series exports, a NetCDF file of temperature and relative humidity data compliant with CF conventions and a customizable CSV format of temperature time series (see observations from Lac de Gras in Nordicana-D).
Database organization
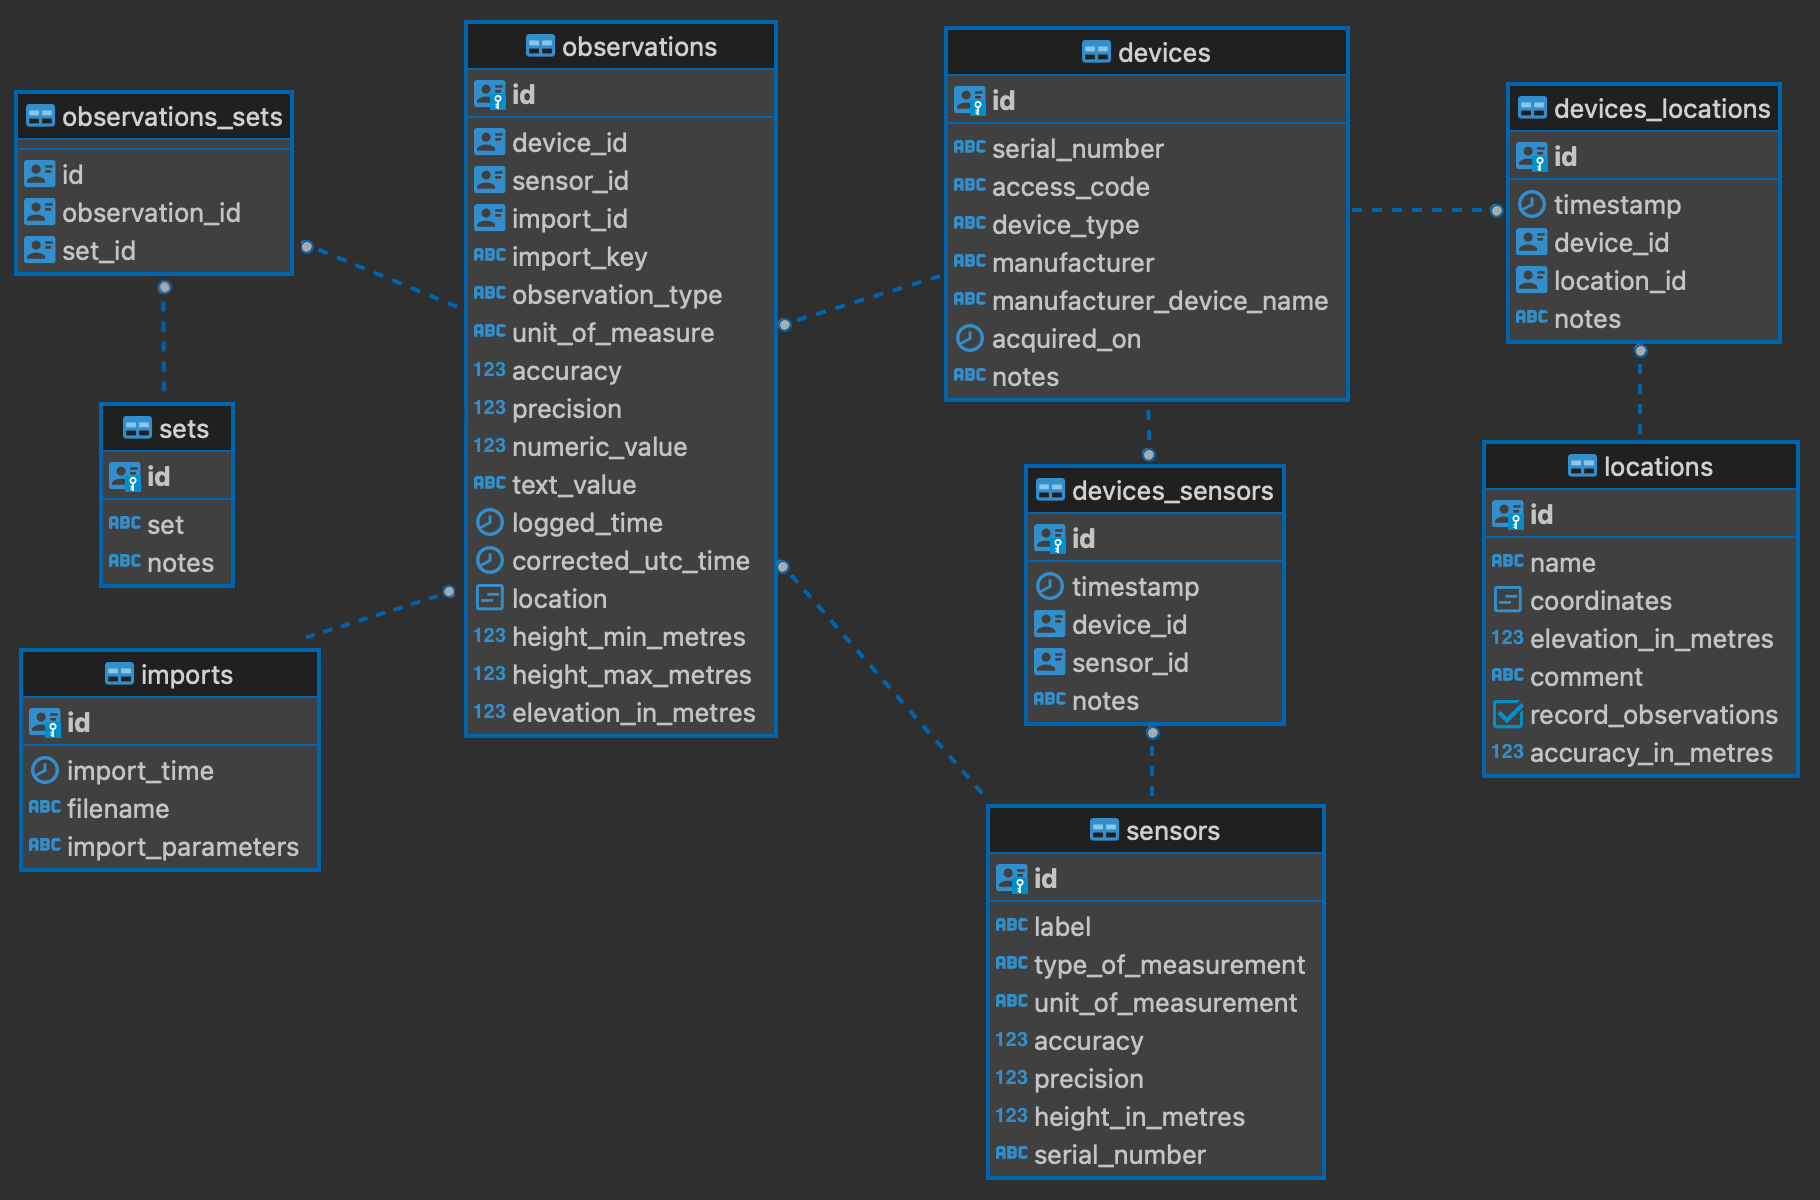
Devices and sensors: Every observation is associated with a device and sensor. A device may have one or multiple sensors. In the case of a thermistor chain, the device is the data logger and the sensors are the thermistors along the chain. The device only requires a unique identifier (id), whereas the sensors require a unique identifier (id), the id of the device to which it is associated (device_id), a label and a measurement type (numeric/text).
Observations: The bulk of the data is contained in the observations table. An observation may be of type numeric (e.g., temperature measurement, soil thermal conductivity, vegetation height) or text (e.g., soil type, vegetation type). Every observation has a time, height, device, sensor, elevation and a location associated to it. The height is described by its maximum and minimum to allow for observations that span multiple heights or depths, for example soil texture. The database structure it not fully normalized to simplify data access queries and, consequentially, the observations table contains redundant data.
Locations: Locations may be points or polygons and must have a unique identifier (id), coordinates and an elevation. The record_observations field indicates whether the observations are to be recorded at this site (TRUE/FALSE). For example, when the temperature time series for a logger is imported, temperature measurements taken while its location is designated as storage will not be imported.
Devices_locations: This table connects the devices and locations tables such that a device (device_id) is situated at a location (location_id) at a specific time (timestamp).
Dois: This table stores DOIs associated with the data to ensure attribution of each single observation to an author or originator is possible. For flexibility, every observation may be given one or several DOIs. This mechanism may also be used to identify subsets of the data, for example identifying observations used for one particular publication or identified as having passed a particular quality check.
Current data
Permafrost monitoring sites are set up in Umiujaq Quebec, in the mountains of British Columbia and in the Northwest Territories. The largest networks are within the NWT near Yellowknife within the discontinuous permafrost, at KDI, an exploration camp at the tundra-taiga transition and near Ekati Diamond mine / Lac de Gras, within the continuous permafrost zone.
In total, there are 341 ground (LOG-PT1000), 19 air (M-Log5W-US-HUMIDITY) and 63 rock (M-Log5W-US-ROCK) temperature loggers and 50 thermistor chains (LOG-HC2 ) within the database that are associated to a location and currently in the field (see table below). Most of these currently have one to two years of data in the database. Manual observations (e.g. LAI, vegetation height, soil texture) are also stored for many sites within the KDI and Lac de Gras networks.
| Sensor | BC | Deline | KDI | LDG | Umiujaq | Yellowknife |
| Temperature loggers | ||||||
| M-Log5W-US 10m chain | 0 | 0 | 5 | 10 | 0 | 0 |
| M-Log5W-US 15m chain | 0 | 0 | 0 | 9 | 0 | 0 |
| M-Log5W-US 20m chain | 0 | 0 | 0 | 9 | 0 | 0 |
| M-Log5W-US 5m chain | 0 | 0 | 7 | 10 | 0 | 0 |
| M-Log5W-US-SIMPLE | 20 | 3 | 82 | 179 | 15 | 42 |
| M-Log5W-US-HUMIDITY | 0 | 0 | 4 | 7 | 0 | 8 |
| M-Log5W-US-ROCK | 18 | 0 | 10 | 9 | 9 | 17 |
| Manual observations | ||||||
| drainage_tendency_estimated | 0 | 0 | 96 | 212 | 0 | 0 |
| LAI | 0 | 0 | 68 | 156 | 0 | 0 |
| landscape_feature | 0 | 0 | 18 | 44 | 0 | 0 |
| slope_angle | 0 | 0 | 14 | 0 | 0 | 0 |
| slope_aspect | 0 | 0 | 10 | 1 | 0 | 0 |
| snow_deposition_tendency_estimated | 0 | 0 | 13 | 43 | 0 | 0 |
| soil_electric_conductivity | 0 | 0 | 18 | 39 | 0 | 0 |
| soil_heat_capacity_volumetric | 0 | 0 | 18 | 39 | 0 | 0 |
| soil_moisture_volumetric | 0 | 0 | 18 | 39 | 0 | 0 |
| soil_texture_estimated | 0 | 0 | 18 | 39 | 0 | 0 |
| soil_thermal_conductivity | 0 | 0 | 18 | 39 | 0 | 0 |
| stick-up_height | 0 | 0 | 0 | 41 | 0 | 0 |
| surficial_geology | 0 | 0 | 19 | 44 | 0 | 0 |
| thawdepth_m | 0 | 0 | 67 | 32 | 0 | 0 |
| topography | 0 | 0 | 19 | 44 | 0 | 0 |
| veg_height | 0 | 0 | 75 | 165 | 0 | 0 |
| veg_plant_community | 0 | 0 | 14 | 44 | 0 | 0 |
| veg_species | 0 | 0 | 77 | 160 | 0 | 0 |