Google Analytics (GA) is a powerful tool used to track and analyze crucial data concerning a website’s performance, giving a website owner further insight into their business.
GA produces all kinds of different reports detailing how your website is performing, allowing you to make more informed decisions moving forward. However, while these reports are useful, it can be intimidating to try and learn what they all mean as a beginner.
This article will aim to help breakdown GA for newcomers, allowing them to better interpret their GA statistics.
Three Important Categories Google Analytics
At its core, GA is quite simple. It can be broken down into three main categories: who is looking at your site, how they got to your site, and what they are doing on your site. For the most part, we can organize the reports GA provides into these areas.
Each of these three questions can be answered by visiting the “Audience, Acquisition, and Behaviour” menu items on the left side of the screen. Here is a brief breakdown on each of these categories.
Audience – Who is Looking at Your Site?
By visiting the “Audience” section, you will be able to draw from all sorts of data about the users who visit your site. Knowing more about your audience will help you improve your website design, navigation, and content by tailoring them to your audience. Additionally, since you know who they are, you’ll be better equipped to drive the right traffic to your site by utilizing the correct keywords and avoiding unnecessary jargon.
Audience > Overview
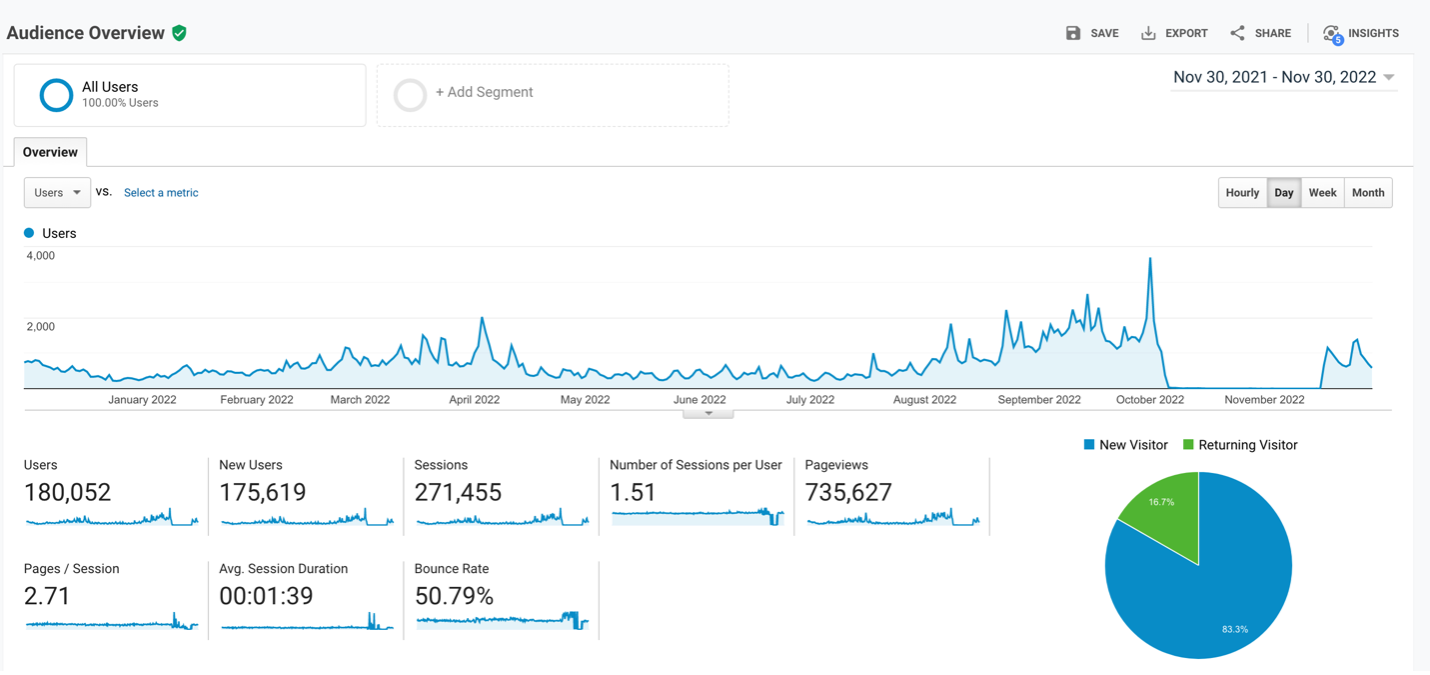
Here, you will see a graph that shows trends based on the number of visits to your site or a specific page from a specific time frame. In the top right corner just above the graph, you will have the option to select different time frames (hourly, day, week, month), which will each reveal different trends.
Another way to revise the time frame for your graph is in the upper right-hand corner of the page. You will see a date range that you can customize from one date to another. This feature grants you control over comparing site visits within any date range possible.
In this view, you can also compare the percentage of new visitors to returning ones as well as what language users are viewing your site in.
Audience > Demographics > Overview
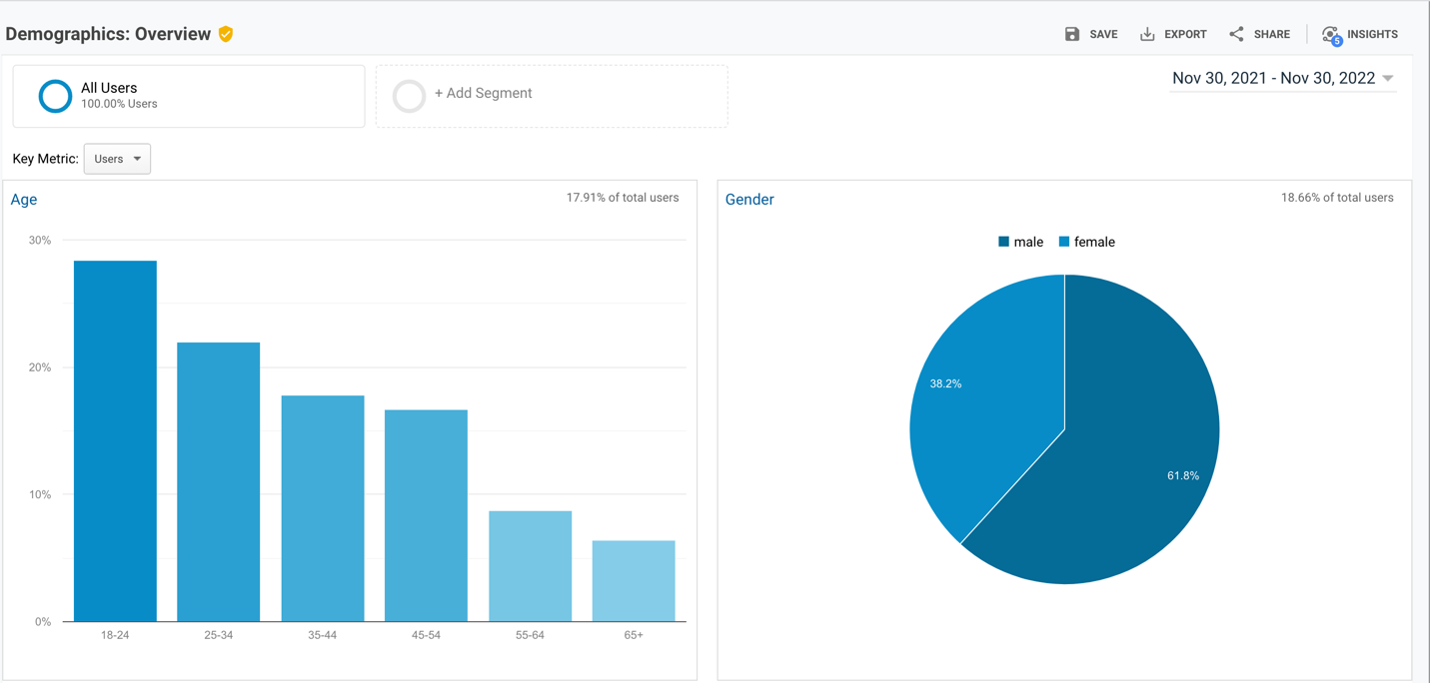
Here, you’re given a bar chart informing you of the least to most common age groups that visit your site. Additionally, you’re presented a pie chart that breaks down the gender split of your site’s visitors.
Audience > Technology > Browser & OS
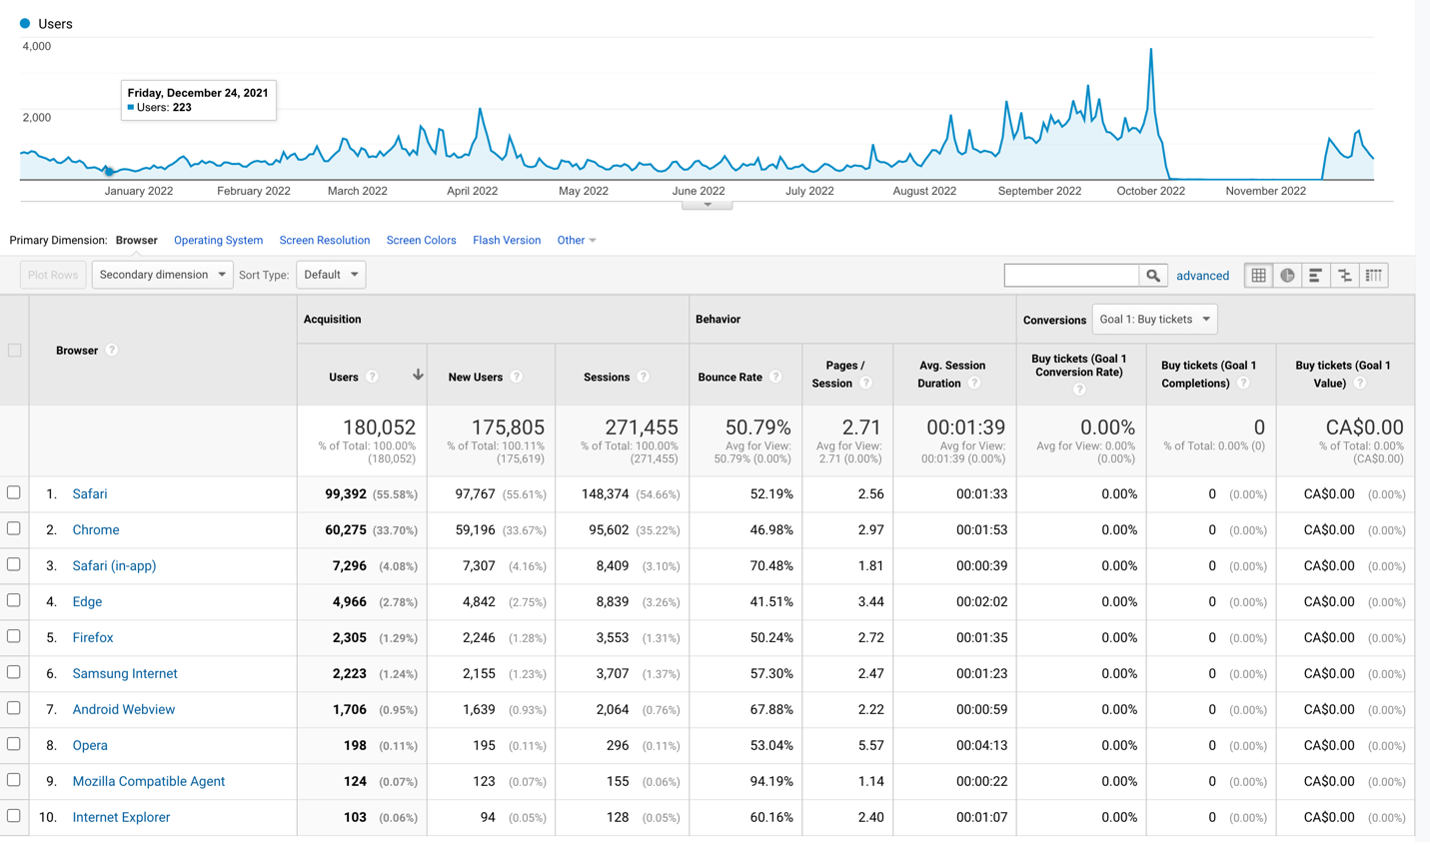
In this section, you can view which browsers and operating systems are most used by your site’s visitors. Additionally, you can track and compare their behaviour to each other.
Audience > Mobile > Overview
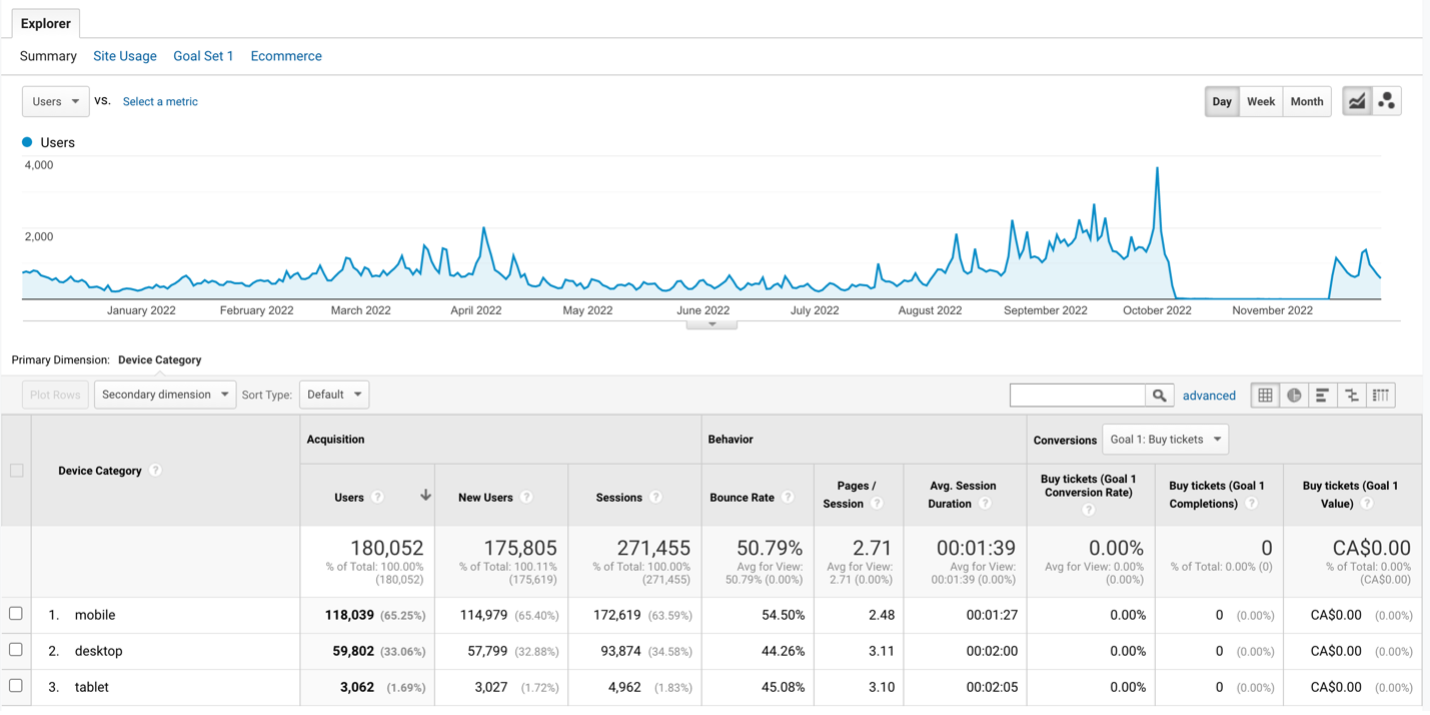
On this page, you can compare how often users visit your site using a mobile phone, laptop, or tablet. Knowing this information will help you narrow your focus on improving your website for whichever of these devices.
Audience > Geo > Location
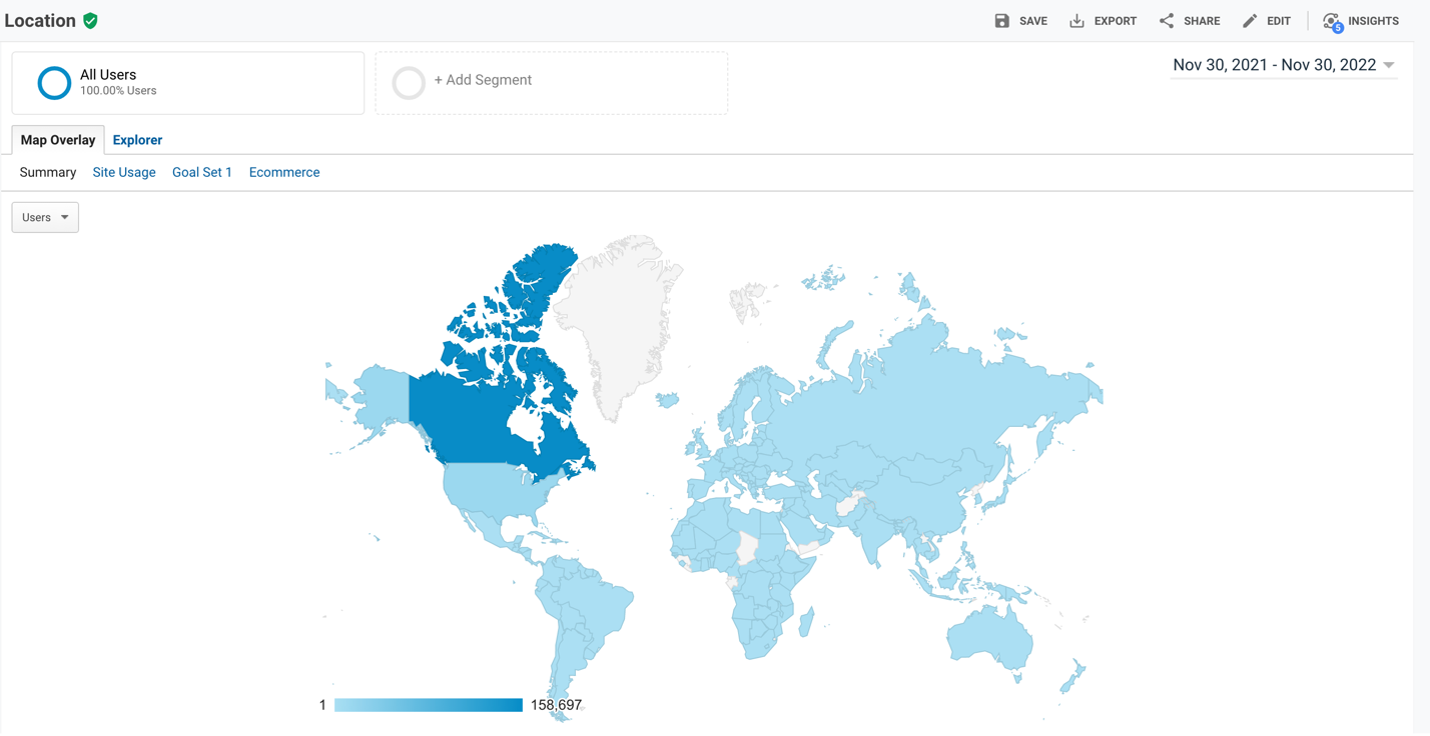
This path will show you where in the world your site’s visitors are located. The default view ranks your visitors by country; however, you can narrow their location down even further. If you click into a country, you can compare the number of visitors in the provinces/states of that country. If you click into a province/state, you can pinpoint the location of the device of every visitor that lands on your website. This feature is useful for many companies that want to create targeted ad campaigns.
Behaviour – What People are Doing on Your Site
By clicking on the “Behaviour” section, you’re able to view where your visitors traverse through and how they interact with your website. Knowing this information will not only help you optimize your content, but it will also enable you to guide users down your preferred path.
Behaviour > Site Content > All Pages
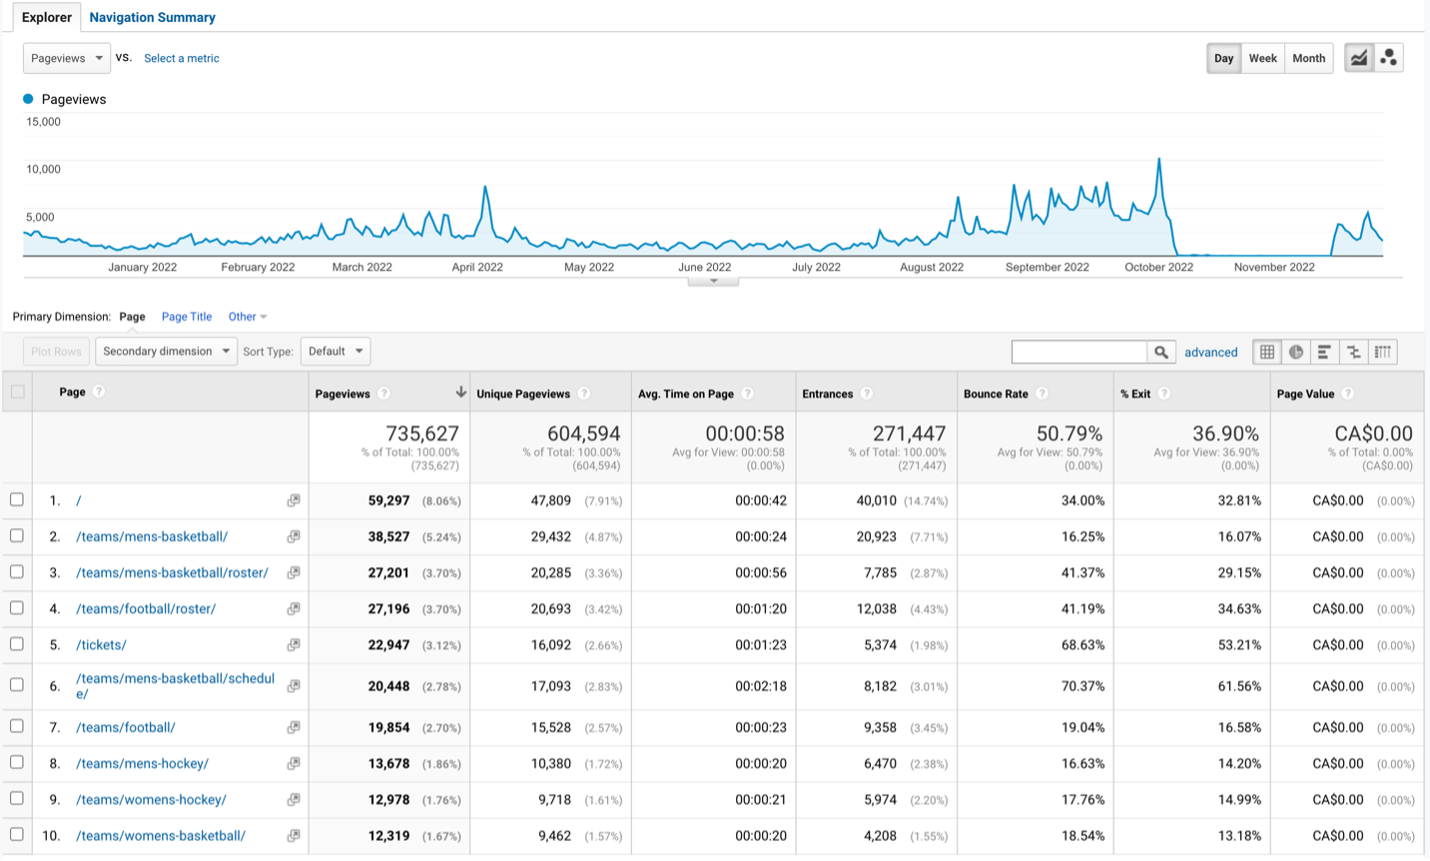
This page is one of the most important areas of GA as it allows you to take an in-depth look into the statistics of each page on your site. It lists a variety of statistics with specific headers. We will now go into detail about what these statistics mean.
Behaviour > Behaviour Flow
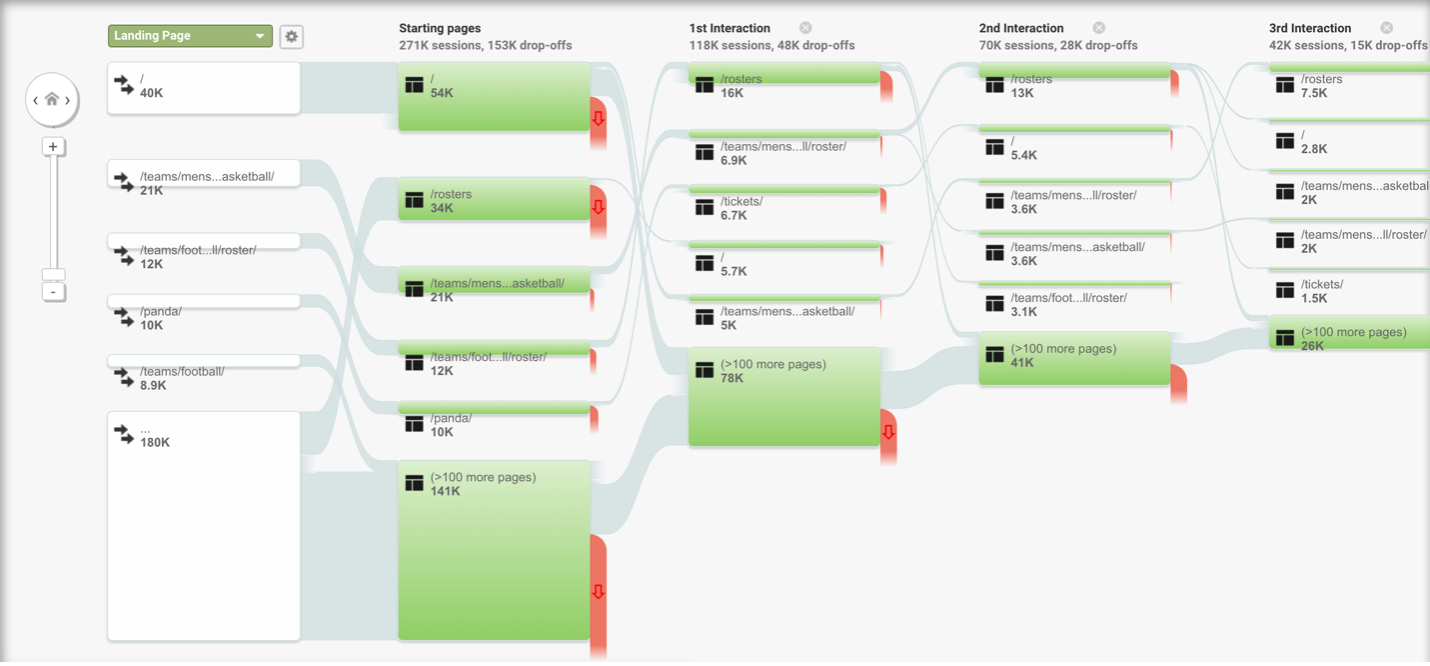
This view shows you where users are entering your website, the paths they take while navigating through your site, and where they leave. This feature reveals the most frequent pathways users are using to traverse your site. Understanding these patterns will help you prioritize what to change with your site. If visitors are often taking paths away from your desired objective, think about how you can update your content to set them on the path you want.
Acquisition – How People Arrived at Your Site
The last important category of GA is discovering what avenues led your users to finding your site. Knowing this information will help you focus on improving avenues that aren’t sufficiently bringing users in.
Acquisition > All Traffic > Channels
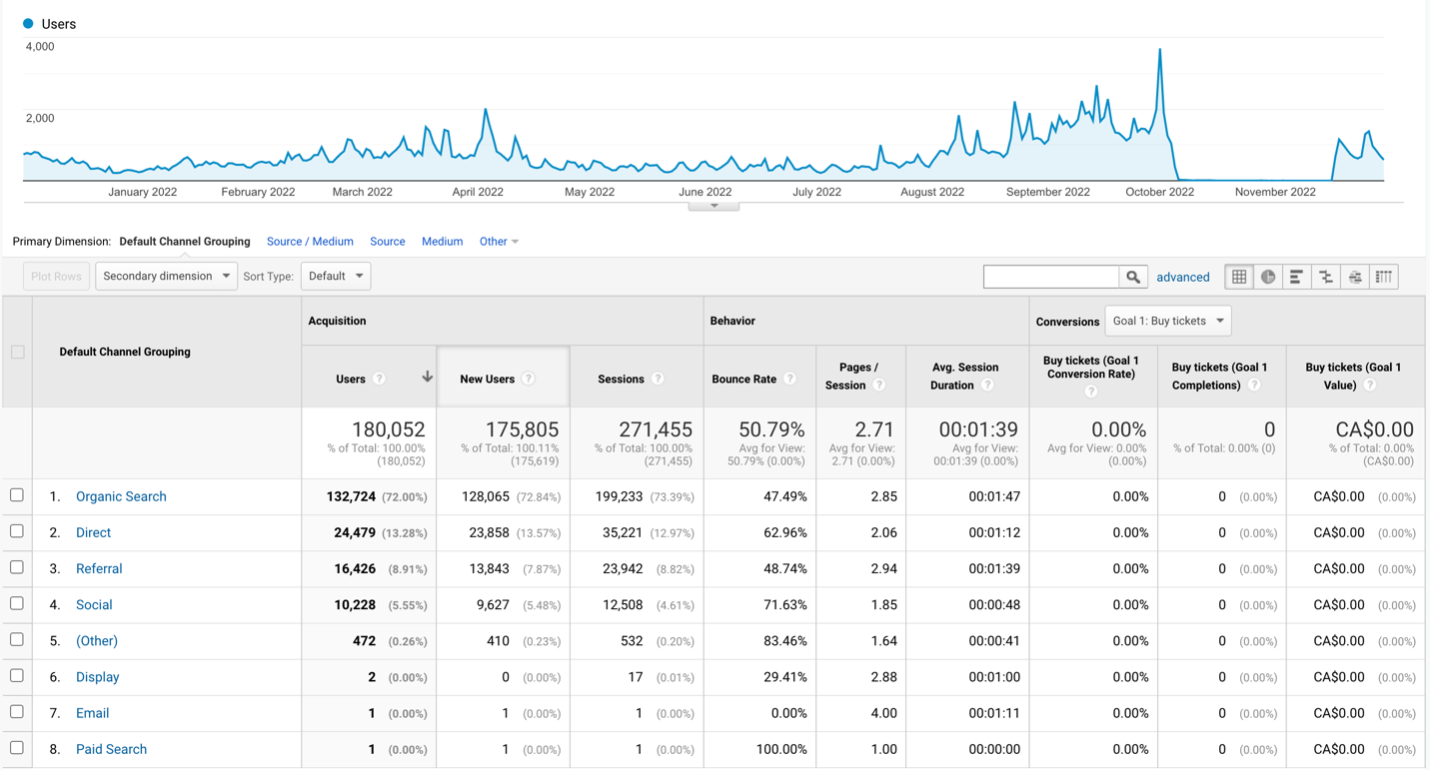
This page compares the number of users different avenues have brought to your site. By clicking on one of them, you can see a more specific breakdown of how the users were brought in. For example, when clicking on “Organic Search” you can view the pages people land on. Here are some of the avenues that bring users in:
Final Thoughts
We highly encourage every website owner to take advantage of Google Analytics. While many of its advanced reports can be intimidating, the basic ones covered here should be more than enough for you!
If you’re interested in having a Google Analytics account created for your site, visit the ITS Service Desk Portal and raise a request!
Click here to access the training video for the left navigation menu!