Exploring Varied Challenges in CRA Reporting: Insights by Charity Age, Size, and Location
In a previous blog post, my colleague Dr. Kim Nguyen discussed the challenges our survey participants experience with CRA reporting requirements. In this post, I will expand on these findings from our CICP Week 10 survey “CRA Form T3010A,” to explore how the challenges charities face with CRA reporting may vary depending on their age, size, and location. For more context on how we classify charities based on size, age, and location, please refer to our earlier posts: “Does size or age matter? Describing charity demographics” and “Harnessing the Power of Geography in Analyzing Survey Data from the Charity Insights Canada Project (CICP)”.
CICP Year 2, Week 10 Respondents – We received 859 panellist responses to our survey on CRA reporting requirements, providing good representation across the five age groups we use to classify charities. It is, however, important to note that our sample does not include charities in their first or second year of operation, as our recruitment process relies on available CRA databases for charity contact information and up-to-date data was not available to us at the time of our panel recruitment.
For charities of different sizes, the distribution of responding panellists for Week 10 was somewhat uneven, with the largest representation in the medium to extra-large categories (752 panellists). The lower representation of smaller charities with annual expenditures under $61,529 (107 panellists) may reflect their limited staffing and resources, which could also impact their ability to participate in surveys more generally.
When grouping charities by location, approximately half of our Week 10 responding panellists were from large urban areas (492 panellists), which aligns with Canada’s population density. Yet, there were many charities participating who are in rural areas (118 panellists) and small and medium sized population centers (153 and 96 panellists respectively). This geographic diversity offers valuable insights into how charities across different locations experience CRA reporting challenges.
Another way to group charities is by province or territory of operation. When analyzing our Week 10 survey results by provinces and territories, most responses came from Ontario (298 panellists), Quebec (173 panellists) and British Columbia (149 panellists), reflecting the population distribution of these provinces. Smaller provinces like New Brunswick (26 panellists) and Nova Scotia (24 panellists) were also represented in the survey, though to a lesser extent. For reasons of confidentiality and statistical measure, in this analysis of our Week 10 results, I will utilize only the provinces and territories in which we had more than 10 panellist responses.
Challenges that Charities Face with CRA Reporting Requirements –
The most common challenges survey panellists shared in meeting CRA reporting requirements included:
- Data Gathering: Organizing the required data is a significant hurdle for many charities, especially those with limited resources or complex operations.
- Understanding Guidelines: Interpreting CRA guidelines can be complex and daunting, requiring dedicated time and expertise.
- Resource Constraints: Insufficient time, staffing, and budget can make completing the form difficult.
Overall, the experiences of challenges with CRA reporting were quite consistent across charities of different ages, annual expenditures, and locations. It is important however to keep in mind that we do not have a representative sample of smaller and newer charities.
Key findings:
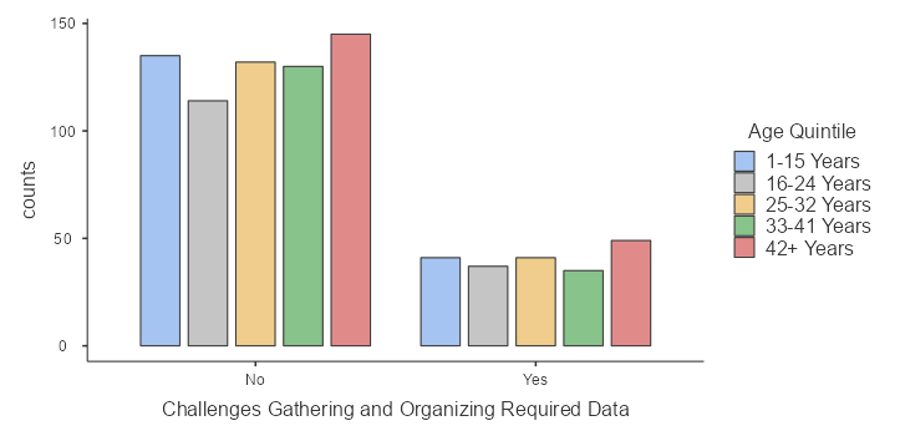
Insights by Charity Age: Across different years of operation, charities experienced similar rates of challenges in preparing the T3010A form. This suggests that regardless of a charity’s age, the core challenges remain consistent. For example, charities of all ages have similar rates of experiencing challenges gathering and organizing the data required for reporting to the CRA, (x2(4, N=859) =0.894, p=0.925). However, the lack of charities in their first or second year of operation means that the experiences of charities new to the process of reporting to CRA are not captured in this survey.
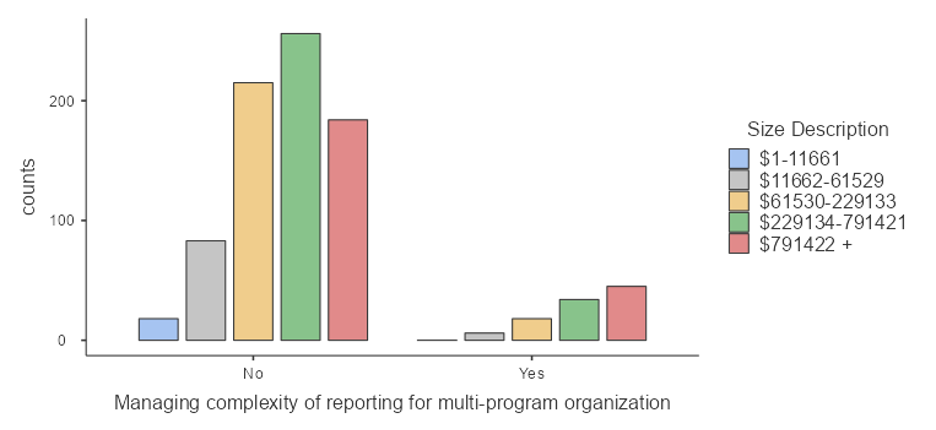
Insights by Charity Size: Charities of different sizes generally faced similar challenges with reporting to the CRA. One notable exception is that extra-large charities (over $791,421 in expenditures) encountered more issues with managing complex reporting for multi-program organizations (x2(4, N=859) =21.5, p<.001). This may be due to the diverse and multifaceted nature of large charities’ operations, which requires a greater level of coordination and attention to detail.
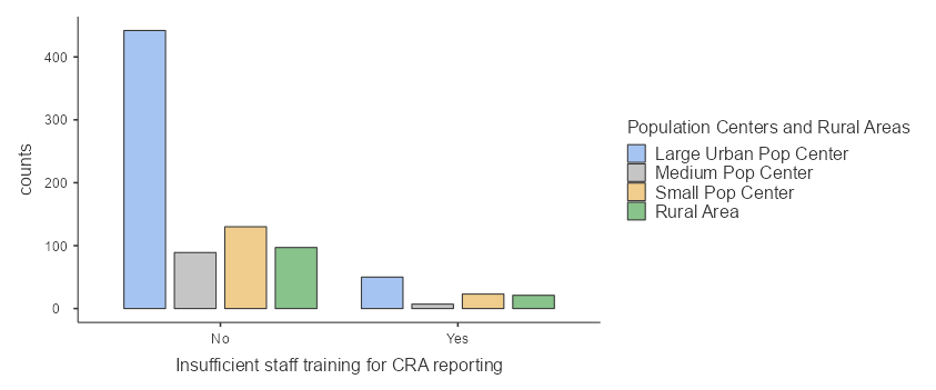
Insights by Charity Location: When examining the results based on charity location, there were notable differences in challenges related to staff training, resource availability, and organizing and gathering data. Charities in small population centers and rural areas reported a slightly higher percentage of challenges due to insufficient staff training compared to those in urban and medium population centers (x2(3, N=859) =8.78, p=.032). This highlights the potential disparities in access to training resources and support for charities in less densely populated areas.
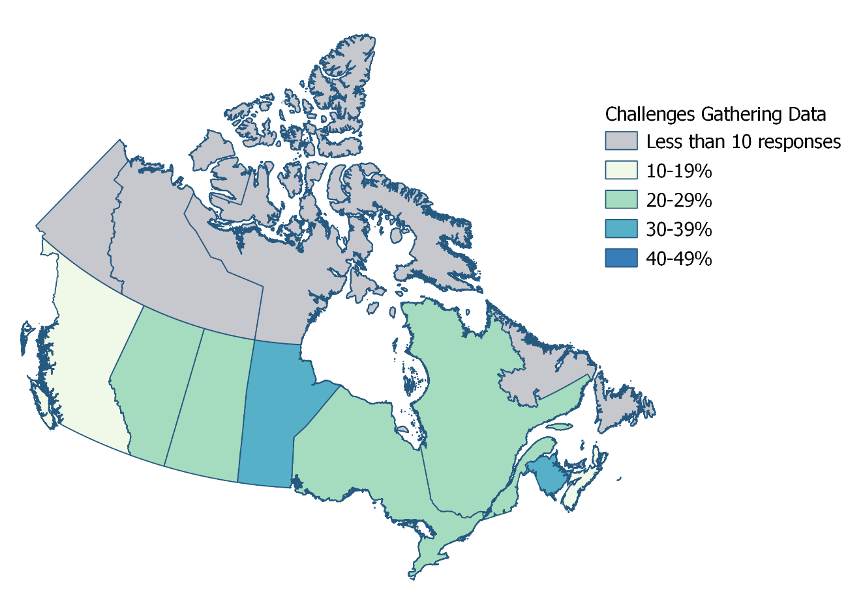
Charities across Canadian provinces reported different rates of challenges due to insufficient resources (x2(5, N=859) =15.3, p=.009) and difficulties gathering and organizing the required data to report to CRA (x2(5, N=859) =13.3, p=.021). In particular, charities in New Brunswick and Manitoba reported higher rates of resource constraints and data gathering challenges. Conversely, charities in Quebec and Saskatchewan faced fewer challenges in these areas.

Conclusion – Our survey results reveal that charities across Canada, regardless of their age, size, or location, face common challenges in meeting CRA reporting requirements. However, there are notable variations in the types of challenges experienced based on the size and location of charities. Extra-large charities struggle more with the complexity of reporting, while those in small population centers and rural areas have more challenges with training staff on reporting requirements. Additionally, differences in challenges across provinces suggest that regional factors may play a role in the difficulties charities face.
Author

Want to receive our blog posts directly to your email? Sign-up for our newsletter at the following link: https://confirmsubscription.com/h/t/3D0A2E268835E2F4
Maps created using the Free and Open Source QGIS
Charts created using The jamovi project (2022). jamovi. (Version 2.3) [Computer Software]. Retrieved from https://www.jamovi.org.

Allies in Affordability
According to the 2026 Food Banks Poverty Report Card, one in four people in Canada are food insecure and many of them are employed but …

When DEI isn’t formalized, but still matters
This cohort stood out in Charity Insights Canada Project data: the charities that report having no diversity, equity, and inclusion (DEI) policies or practices. Within …

Why Data Literacy Matters More Than Ever for Canada’s Charitable Sector
Data literacy has become a necessary skill across the charitable sector because organizations are being asked to make decisions more quickly, demonstrate impact more clearly, …