C-8’s Opportunity: Replace Chalk Lines with Metrics

Tyson Macaulay, CISA, CEI LEL
Deputy Director, National Centre for Critical Infrastructure Protection, Security and Resilience
Up to the late 1500’s ships weren’t built to a plan. Craftsmen applied apocryphal guidelines and drew lines on the floor to eyeball dimensions. This approach had clear drawbacks for fleets of conquest or commerce: ships were harder to reproduce, maintain, and supply; performance and stability varied widely; hidden structural weaknesses regularly slipped through construction; and standardized spares and repairs were impossible.
This made operational risk high. Starting in the 16th century, ship-building methods became standardized: mathematical hull geometry, and naval classifications emerged making safety, quality and resilience measurable and visible. Data from Lloyd’s insurance going back to the 1600’s show substantial reductions in losses to life and property as formal standards emerged.
In Canada today, critical infrastructure protection (CIP) still resembles that pre-plan era of shipbuilding: deciding what counts as “critical” within the ten official sectors is more craft than science. The consequence is predictable: perceptions of risks vary widely, regulatory expectations are uneven, and national-level situational awareness is blurry when it most needs to be sharp. Jurisdictions are often left to their instincts, and CI owners/operators often apply very different methods; some rely on institutional memory and ad hoc thresholds. The result for public safety and national security is inconsistency: an asset type can be considered “critical” but also invisible to interdependency analyses that should tie the whole system together.
The ten defined CI sectors in Canada are a useful policy scaffolding: Energy, Finance, Telecommunications, Food, Water, Health, Transportation, Manufacturing, Safety, and Government. But the practical determination of who is “in” or “out” of each sector often looks like a shipwright’s chalk lines on the floor: mutable, subjective, and difficult to defend under stress. Some industries fall into grey zones; intuitively critical under some conditions but not all. That ambiguity bleeds into regulation, emergency planning and cross-border coordination, where counterpart definitions abroad can be both different and tighter. A taxonomy that cannot be applied consistently cannot be managed consistently.
The drawbacks of metaphorical chalk lines for CI sector definitions are not merely academic. Regulators need to know exactly whom they regulate and why. During a crisis, decision makers must justify the order in which lifeline resources like power, bandwidth, medicines, or fuel are triaged and restored. Ideally, they make decisions using criteria that will survive public scrutiny and after-action review. Similarly, post-incident reporting needs clean definitions to compare events across time and regions, to see whether regulations work and where dependencies may be changing. Without methodical definitions, we generate noise: incomparable risk registers, incompatible outage and recovery metrics, and assessments that cannot be pooled or trended.
A prime case in point is Bill C-8 “An Act respecting cyber security, amending the Telecommunications Act and making consequential amendments to other Acts” which establishes a cyber protection regime for federally regulated CI sectors, namely Telecommunications, Finance, Energy, and Transportation. The policy intent is sound: align oversight with systemic risk, sharpen reporting duties, and develop detailed regulatory guidance. But to be maximally effective, the instrument needs a crisp, modern, quantitative scoping logic. One that reflects how CI sectors are composed and how goods and services are delivered in 2025; considering layered platforms, cross-border supply-chains, and shared infrastructure that does not map neatly onto legacy sector definitions. If scope rests on dated or vague definitions, we will regulate the core while the systemic risk remains in the unseen edges.
Consider “Telecommunications,” last operationally framed in the early 2000’s to include radio, television broadcasting, and print media in a time when carrier networks moved voice, video and data mostly separately versus everything based on Internet Protocols today. Two decades on, the sector has changed tremendously. Where do industries like data centres, cloud platforms, and AI clusters sit? Such questions become important when up to 50% of the cloud and software-as-a-service consumed by Canadian CI (Finance in particular) are imported and controlled by entities outside Canada. Figure 1 below visualizes how imports of “Computer design and related services” account for the largest single input into the Financial service industry in Ontario (Canada’s financial hub) – 50% of these critical services are imports, delivered through cross-border trade dependencies.
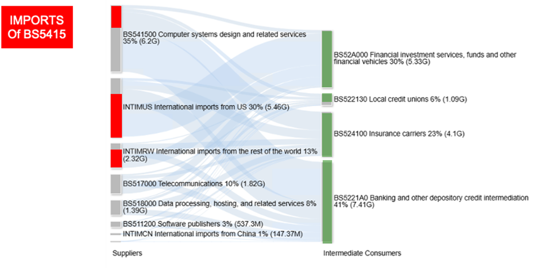
Figure 1: BS5415 – Computer Systems Design and service – Financial Industries in Ontario 2022
Another major consideration in the area of Telecommunications CI: there are no Canadian-owned Content Delivery Networks (CDN). Yet those CDNs underpin the service delivery of almost all e-government portals, online banking, and cultural (CBC, CTV) platforms. Over 65% of Canadians in 2024 relied on a mix of online streaming and legacy “linear TV”, while another 20%+ of Canadian only streamed content via these CDNs. (Source: ThinkTV) If our CI definitions miss these realities, we create rules and regulations with diminished effectiveness.
Like modern ships, CI definitions must be grounded in reliable systems, not rules of thumb. With clear definitions, Canada can apply quantitative supply-chain metrics from Statistics Canada to identify which industries and regions are truly consequential under different impact scenarios. In parallel, we should explore additional indicators of CI interdependence for correlation with supply-chain metrics. For instance, the sensitivity of data flows, geographic proximity or distinctions between goods and services. With more than one indicator available, correlations (or lack of) will begin to expose the strengths and gaps in both definitions and measurement. Ultimately, these metrics turn intuition into evidence, making “criticality” a testable, reproducible property rather than a label assigned by tradition.
The same logic applies to risk assessment. Today, municipal and provincial emergency management offices expend heroic effort, but their outputs rarely interlock: differing templates, scales, hazard taxonomies, and consequence categories frustrate analysis across jurisdictions. A nationally standardized toolkit with common CI definitions, hazard libraries, and risk scales would let assessments be rolled up and aggregated. When every risk assessment and after-action report speaks the same language, trends emerge and controls can be prioritized by evidence, not anecdote. Standardization is not centralization; it is the grammar that allows a federation to reason collectively.
Call to action
First, treat Bill C-8 as a once-in-a-generation chance to replace chalk lines with mathematics. Use the legislative refresh to embrace a systematic, quantitative methodology for defining CI membership rooted in trusted measures like Statistics Canada’s econometrics. By this path, regulatory scope, security targets, and emergency management practices can all rest on the same defensible foundation. When the “who” of CI definitions are founded on metrics and modeled consequences, stakeholders can regulate, plan and invest quickly and with confidence.
Second, work with Canadian standards bodies to publish a canon for risk assessment, definitions, data standards, scoring scales, dependency questions, and reporting templates. At that point, federally and provincially mandated assessments can be compiled, trended, and compared coast-to-coast-to-coast. This is how we turn thousands of local efforts into national intelligence: using interoperable methods, open guidance, and a commitment to measure what matters the same way everywhere. As in the evolution from chalked floor lines to naval architecture, the payoff is practical: fewer surprises, faster recovery, and a resilient, more prosperous Canada.