Modeling a Trade War: Critical Infrastructure Dependency on China

Modeling a Trade War: Critical Infrastructure Dependency on China.
Summary:
What would the impact of a Chinese trade war be on Canadian (and similarly U.S.) Critical Infrastructure (CI), from a national security and policy perspective?
The following Canadian critical infrastructure sectors and industries appear most vulnerable to a protracted trade war (> 2 months – typical factory-to-consumer shipping time) with China:
• Food sector (Crop, Fruit, Seafood)
• Health sector (Hospital and Pharmaceuticals)
• Manufacturing (Aerospace and Chemicals)
• Telecommunications and Transportation dependency on non-critical (by definition) Chinese export industries creates a blind spot
COVID-19 created unprecedented trade disruptions in 2020. Countries wanted to trade but public safety concerns threw up complex and variable trade impediments. During the COVID period in 2020, Canadian trade with the U.S. dropped by 11% from 2019, Mexico dropped 21%, and trade with the Rest of the World (ROW) was down 10%. Yet, trade with China grew by 1% between 2019 and 2020. A similar pattern is seen in the United States, where Chinese export industries saw the smallest decline of the top three trading partners and the ROW. See Table 1 below in $CDN. This possibly reflects the unclear relationship that many countries have with Chinese trade: Chinese goods are not easily substituted based on their low price, the economies of scale and industrial policies behind those prices.
| Canada[i] | 2019 | 2020 – COVID | 2021 | 2022 | 2023 |
|---|---|---|---|---|---|
| US | $485B | $433B (-11% YOY) | $475B | $586B | $605B |
| China | $50B | $52B (+1% YOY) | $60B | $73B | $63B |
| Mexico | $24B | $19B (-21% YOY) | $21B | $29B | $33B |
| ROW | $223B | $200B (-10% YOY) | $219B | $262B | $273B |
| United States[ii] | 2019 | 2020 | 2021 | 2022 | 2023 |
| China | $624B | $600B (-4% YOY) | $701B | $745B | $592B |
| Mexico | $495B | $449B (-9% YOY) | $531B | $628B | $660B |
| Canada | $442B | $375B (-15% YOY) | $496B | $607B | $581B |
| ROW | $1902B | $1815B (-5% YOY) | $2203B | $2521B | $2448B |
Table 1: National imports 2019-2023, Canada and United States on $CDN.
But what if the price of Chinese goods suddenly changed, making them not just expensive but unaffordable? What happens in a trade war: intentional trade impediments that throttled shipments of (mostly goods) from China for an unforeseeable period?
Pointedly from a national security and policy perspective, what would the impact of a Chinese-Canada trade war be on Canadian Critical Infrastructure (CI)?
There are clear supply-chain relationships and dependenciesbetween Chinese export industries and importing Canadian CI. In 2023, China exported $63 Billion CDN to Canada. Figure 1 looks at the largest 9 export industries from China to Canada:industries worth over half a billion CDN$ or more in 2023. This is what people tend to focus on and where the tweets and sound bites cluster around the risks of a trade war.
In Figure 1,2 and 3 below, the Chinese export industry on the left sends goods or services to the consuming industry on the right, which can be using the goods for creating more goods or services (Intermediate consumption) or a form of final consumption (like personal consumption or capital investments). The thickness of each bar represents the proportional value of the Chinese export industry, the curved lines connecting the industries indicates the fraction of that value flowing to importing Canadian consumer (intermediate industry or final). The codes next the Industry names are the standardized North American Industry Classification System (NAICS) employed by StatsCan and the U.S. Bureau of Economic Analysis.
As seen in Figure 1 below, none of the top export industries from China to Canada are considered “critical” under existing Public Safety Canada (PSC) definitions. By looking at the supply relationships of these top export industries, the picture changes with at least 2 CI industries showing a dependency (highlighted in red) because of their supply dependency on non-critical industrial imports from China: Telecommunications, Information and Cultural Industries and Hospitals. The “B” code for Telecommunications indicates that these inputs are used for intermediate consumption – used in the delivery of telecom-related services, such as the CI “M” code (final consumption capital investment) of Information and Cultural Industries which includes CI such as telecom networks, internet and datacenters. The “GS” code stands in Hospitals stands for “Government Services” (in Canada’s socialized medical system), which is intermediate consumption supporting the direct final consumption of health services by Canadian citizens (a separate final consumption code).
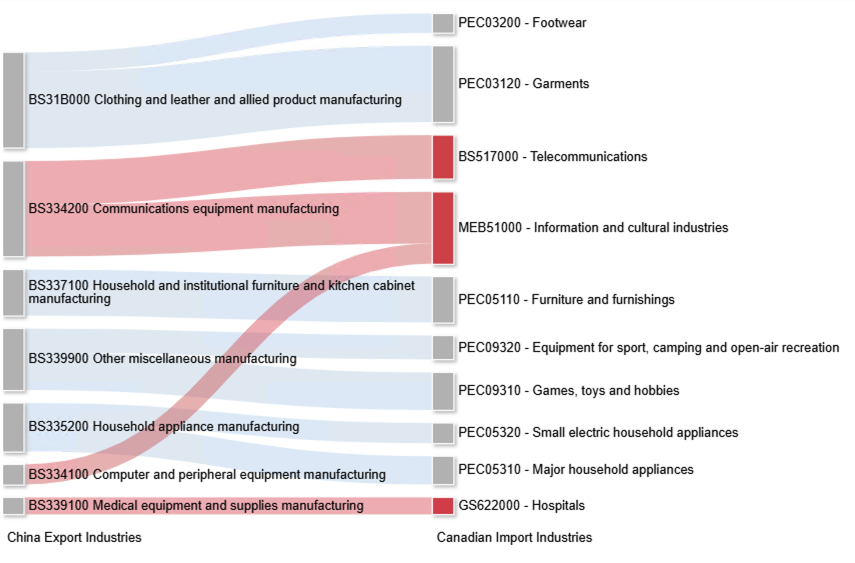
Figure 1: Top Exports by Industry from China to Canada 2023(Source: StatsCan)
In Figure 2 below, only Critical Infrastructure (CI) industrial exports from China are shown, using PSC definitions for CI industries. These industries used between $500M to $60M of Chinese imports in 2023. By looking at direct supply relationships, we can understand how Chinese imports relate to intermediate and final consumption of Canada’s critical industries.
When a CI-filter is applied, the CI dependencies of Canadian Import Industries (the right side) cluster differently than in Figure 1. The Food sector appears to be the most impacted, with both final consumption (P codes) and Intermediate industries (B codes) showing dependency on Chinese imports. The Health sector seems to be the next most affected, with Hospitals and Pharmaceuticals (both final and intermediate consumption) among the highest importers of Chinese goods. Meanwhile, the critical Manufacturing industries like Aerospace have started to show up in the analysis, as well as Provincial Governments (as intermediate buyers of Pharmaceuticals). Also of significance is the absence of the Telecommunications sector, a symptom of being dependent on nominally non-critical industries. This in part shows the need to not merely assess CI risks based on import industries in isolation.
In sum:
• Food sector shows most dependency
• Health significant dependency
• Manufacturing and Government show limited dependencies
• Telecommunications (in Figure 1) dependencies DISAPPEAR because of dependency on non-critical (by definition) Chinese export industries.
Figure 2: Top CI Exports by industry from China to Canada 2023 (Source: StatsCan)
In Figure 3 below, the next order of indirect industrial dependencies is shown on the far right. This last relationship–layer used a minimum value of $60M for imported Chinese goods for the purposes of creating their own goods and services (intermediate consumption). By looking at indirect supply relationships, we can see even more hard-to-assess dependencies associated with Chinese exports to Canada and the implications for industries and citizens.
By looking at indirect dependencies on Chinese export industries, we find:
• Food sector shows additional dependencies
• Health sector shows additional dependencies
• Manufacturing (which includes Basic Chemicals by PSC definition) and Government show accumulating dependencies
• Telecommunications sector dependencies on Chinese export industries remain obscured, if filtering on CI exports directly.
Figure 3: Top CI export cascades by industry from China to Canada 2023 (Source: StatsCan)
Figure 4 below provides a view of indirect supply chain relationships from non-critical Chinese exports and Canadian CI. Telecommunications and Hospital show dependency on Chinese exports, but in turn possess downstream dependencies on more CI. In the case of Telecommunications, a clear feedback loop back into the Telecommunications industry is exposed, which is typical in all CI sectors: there is substantial intra-sector and intra-industry dependency. The focus of consumption also changes when considering this indirect cascading dependency; specifically, final consumption comes back into play as it did in Figure 1 with Information and Cultural industries. For instance, the “M” code for Transportation and Warehousing includes capital investments in transport CI such as Air, Rail, Truck and Marine infrastructure as well as energy CI such as pipelines. Additional cascading CI vulnerabilities are seen in Manufacturing CI (Aerospace) as well as both Federal and Provincial government services.
By looking at indirect dependencies on technically non-critical Chinese export industries, we find:
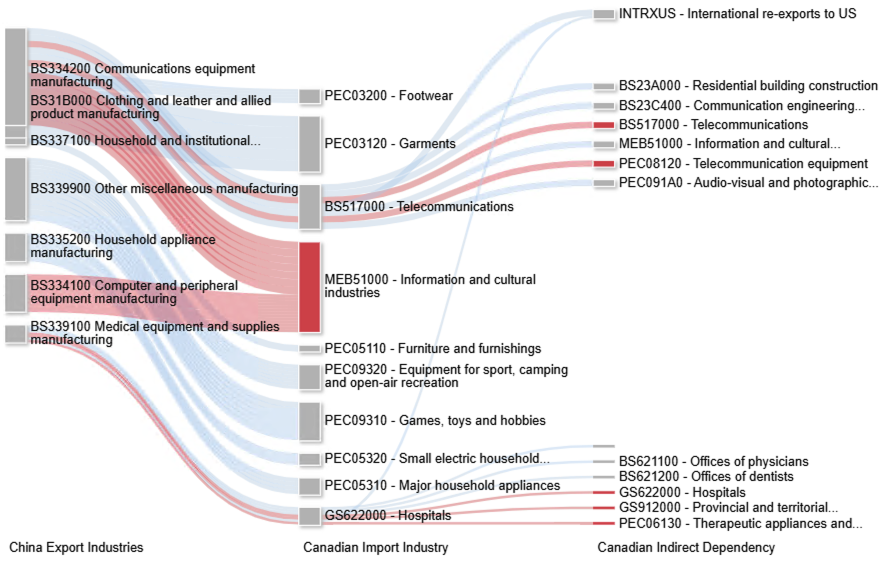
Figure 4: Indirect industrial dependency on Chinese exports to Canada 2023 (Source: StatsCan)
A final note about the cascading effects on Health. Figure 4 shows a direct relationship between hospitals and the Offices and Physicians and Dentists. These have not been flagged as CI because they are not included in available CI definitions, and the practical consideration that many such offices exist in retail spaces which create significant challenges of scope, scale and manageability.
References
Source: StatsCan Input-Output tables 15-207-X
Source: U.S. International Trade Commission
See: StatsCan