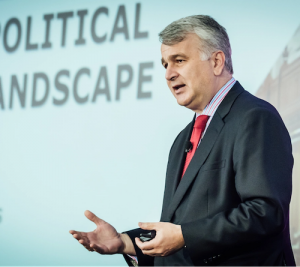
 Nik Nanos founded Nanos Research, a company that works with nonprofit organizations, corporations and government agencies to collect and analyze data. He spoke with PANL Perspectives about the work his company does with the nonprofit sector and about two new initiatives: (1) Nanos Time Map using GIS; and (2) self-service Live Data Portals. Nik Nanos is an author, speaker, strategist and is on a number of boards, including being past Chair of the Board of Governors at Carleton University.
Question: How and when does your company focus on the nonprofit or charitable sector?
 Nik Nanos: Every day. We do research almost every day of the year. It never stops – and work about the nonprofit and charitable sector is among the most important that we do. We’ve been around quite a while, since 1987, and our company has run quite a number of projects.
In Canada, we research how to engage Canadians, how to educate them on big issues, how to have greater impact in terms of social causes, and how to navigate the ecosystems of donor engagement, stakeholder engagement, community engagement and government engagement, among other research topics.
We’re also doing a lot of research on how to motivate volunteers and on volunteer burnout, and how to recruit board members, how to keep donors happy, and issues like that.
For the Nanos team, work with the nonprofit sector is among the more validating sectors for us, because the team feels like they’re doing public good by supporting the charitable and nonprofit sector.
Q: How many staff do you have and how many projects?
Nanos: We have 80 to 100 staff. We run between 40 to 50 research projects simultaneously, and we have dozens of active clients. We generate a smorgasbord of insights and analyses for different sectors, like the culture sector, the health sector, public policy, telecommunications. The diversity of work is what makes it fascinating.
Q: What’s an example of a recent initiative with a nonprofit organization?
 Nanos: We’re doing five projects with nonprofit groups currently. I was just on a call with a nonprofit — a nonprofit with global reach. It’s looking at research to help with strategic planning and the impacts of their brand and visual identity. And because this charity receives funds from the government, it’s trying to better understand how different elements of its charitable mission resonate with Canadians.
Working with nonprofits ranges from issues related to women and children in other countries, to issues about homelessness, to arts and culture, to people’s perceptions related to diversity in the workplace, and a lot more.
Q: In the past few decades, has anything changed in terms of your clients or the sector?
Nanos: When I first started, 30 years ago, charities could do whatever they wanted. They didn’t need evidence. They’d decide, “Here’s what we’re going to do. This is our mission. Here’s how we’ll do it.” This was a world before the internet, and it was easier to manage stakeholders then — and a lot easier to manage information and brand identity and engagement. We’ve gone from that to a nonprofit sector driven by data and micro-targeting. Also, there are a lot more levers at their disposal, levers that are generally financially affordable.
However, I notice that we’re now going through a period of haves and have-nots in the charitable and nonprofit sector. The “haves” have the resources and talent to collect and use data – and they’re getting stronger. The “have-nots” are struggling to deliver on core missions, and they don’t have the time, volunteers or internal resources to use data.
Q: Does Nanos Research aggregate data from other sources, and does it collaborate with others?
No, we’re not aggregating data from other sources, and the research that we do is original. It falls into two buckets: (1) original, proprietary data; and (2) original data that’s shared with the sector.
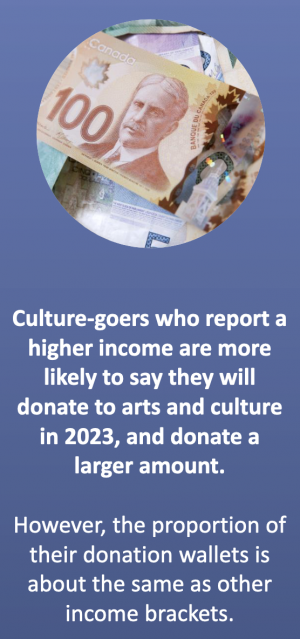
![]() For example, we do a quarterly webinar, Arts Response Tracking Survey, collaborating with the National Arts Centre and Power Corporation of Canada. I present data and insights, and a panel of diverse stakeholders talk about strategies that have upped their game. A few years ago, the genesis of that project was to help the arts and culture sector get through the pandemic, and it later turned into a vehicle to share data — for the whole sector — because there are many organizations within the sector that can’t afford to collect, manage and interpret data.
For example, we do a quarterly webinar, Arts Response Tracking Survey, collaborating with the National Arts Centre and Power Corporation of Canada. I present data and insights, and a panel of diverse stakeholders talk about strategies that have upped their game. A few years ago, the genesis of that project was to help the arts and culture sector get through the pandemic, and it later turned into a vehicle to share data — for the whole sector — because there are many organizations within the sector that can’t afford to collect, manage and interpret data.
Q: What does the future hold for Nanos Research?
Well, two things: Geographic Information System (GIS) mapping and portal building. We’re going to continue to do the research that we’re doing. However, we realized that the data we’ve collected over the last 30 years is probably more important, more valuable, than our revenue. Nanos Research has data about the charitable and nonprofit sector – and data from other sectors – and our future has to do with commercializing that data.
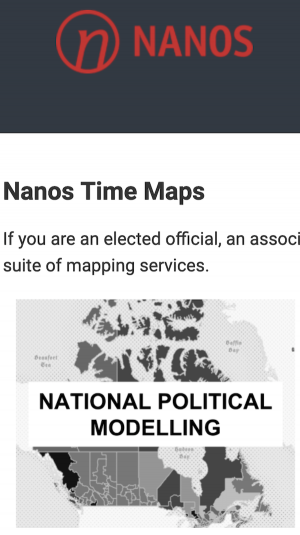 The new GIS dimension, such as Nanos Time Maps, presents data so that clients can target their resources. We have our own GIS team, and the maps visualize data to geographically target activities.
And, increasingly, we’re doing more portal building, such as Live Data Portals, because clients are asking for studies and customized data portals, so that they can self-serve their own access, analysis and studies. We have our own data-portal team. Many clients don’t have statisticians and don’t want to create their own data infrastructure, and these portals allow clients to access data 24 hours a day, and are used internally and shared with key stakeholders. These interactive portals can generate more insights than printed or electronic reports. So, those are two new things.
Photos are courtesy of Nanos Research and Martin Lipman Photography/CREA.
Sign up for MPNL’s free newsletter, PANL Perspectives.
Wednesday, July 17, 2024 in Data Discoveries, For homepage, Fundraising, News & Events
Share: Twitter, Facebook