Infographics & Visual Insights
Explore CICP data in a new format
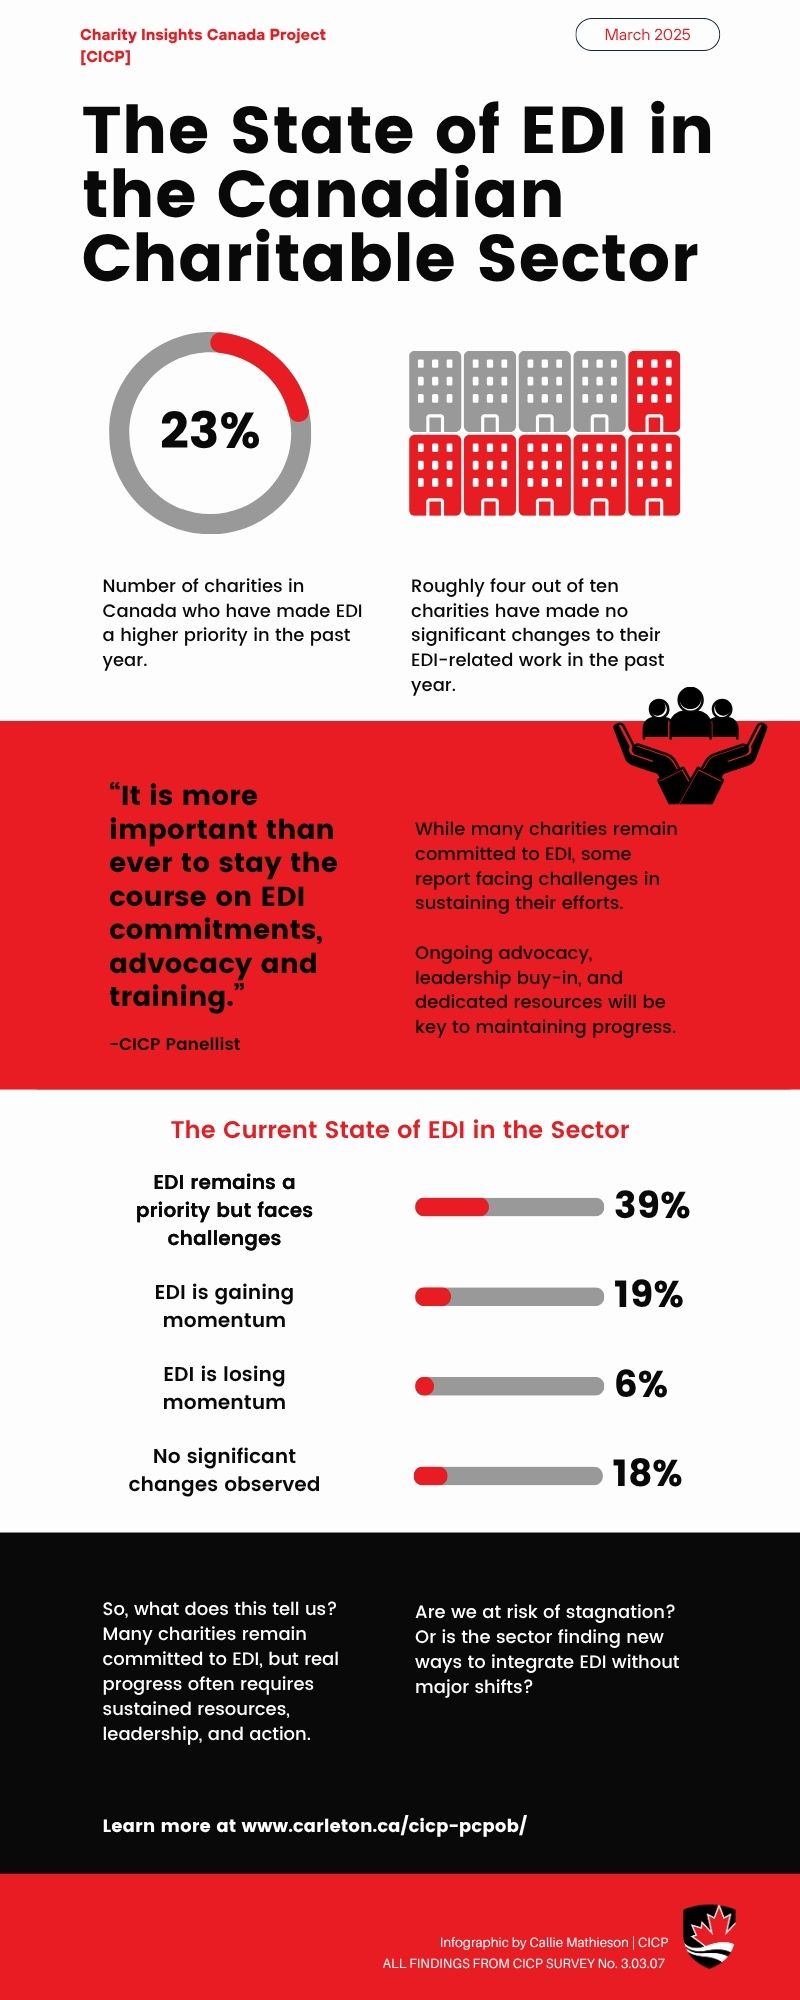
Welcome to our visual hub for key findings from the Charity Insights Canada Project. Each week, we survey hundreds of charities across Canada to understand the evolving realities of the sector — from funding and governance to technology, equity, and beyond.
On this page, you’ll find a series of infographics that highlight emerging trends, recurring challenges, and data stories worth sharing. Whether you’re looking for a quick snapshot or a conversation starter, these visuals are designed to make our findings easy to explore, use, and share.
Want to dig deeper? Check out our reports page and dashboard pages to see more!