Take Note of This: Adding Annotations with Google Analytics
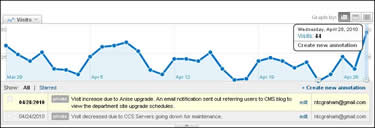
Now that you are well underway with Creating Custom Reports and monitoring significant reporting trends using the Intelligence feature, today’s blog will introduce another new and neat feature to help you organize these trend findings. The Annotation feature allows you to create a note directly in your trending graph to explain a new trend in your data for a given reporting period. For instance, if your Intelligence report detected an abnormal decrease in your site’s visitor traffic, and your research to account for this abnormality revealed that this was the result of a server shut down, you can now enter this information into a note instead of recording this information in your notebook or attempting to commit this to memory. This takes the guess work out of trying to figure out what outside or inside event contribute to the data.
Adding a note
- Navigate to the Trending Graph of the metric for which you want to note a dip or spike in your site’s activity.
Note: Annotations are propagated across all your trending graphs. For example, if you are noting a spike in visitor traffic in the Visits Trending Graph, this same note will appear in the Average Time on Site trending graph. To help you clearly identify for which metric you created the annotation, your note should specify for which metric you are noting the spike, otherwise, you may be looking at a note in a graph that you did not detect any abnormal traffic. - If required, change the Graph by Day, Week, or Month views depending on the reporting period you want to annotate.
- Click on the reporting period tab in the graph and choose Create new annotation.
 The Create New Annotation window opens.
 - Enter your note in the text box. You can enter up to a maximum of 160 characters in the text box.
- Choose whether you want to share your note with all users with access to this profile or to make your note visible only to you. The annotation is attributed to the Gmail login account address that created it.
- Click on the Save button. Your new note is displayed in the trending graph as denoted by the note bubble and below the graph in the note table.

- You can view and edit your note by moving your mouse over the note bubble in the trending graph or by clicking on the Edit button in the note table. You can click on the Star icons under the Show column to control which notes appear in the note table. This function is particularly useful when you start to accumulate multiple notes and want to scale down which notes are displayed in the table.