How to Check Traffic Sources on Specific Pages
In Google Analytics you can see how people are getting to your website by checking the Traffic Sources reports. These reports will tell you the medium (generally one of three – organic/search, direct, or referral) and the source (Google, Twitter, carleton.ca, etc).
Now let’s say you’ve published a post, have optimized it for search engines, and have promoted it on Facebook, Twitter, and the Intranet. How do you know which traffic source was most successful for that post?
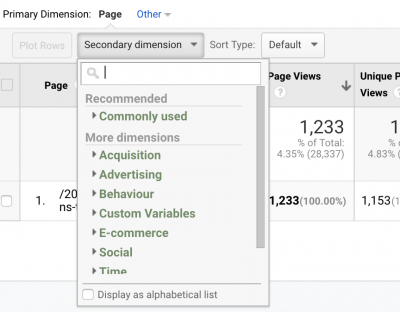
You use a tool called ‘secondary dimension’. This tool allows you to dig into more info – such as traffic sources – on specific pages and posts.
To check traffic sources on specific pages:
- Log into Google Analytics. (Don’t know your username and password? Email its.service.desk@carleton.ca and we’ll get you set up.)
- Click ‘Behaviour -> Overview‘.
Your top 10 pages will appear. If you do not see the page you want to analyze, click ‘view full report’ on the bottom right corner. - Click the page you want to analyze.
- Click the Secondary dimension drop down menu.

- Within the drop down menu, click Acquisition -> Source (or medium, depending if you want to see general or specific traffic sources).
Your list of traffic sources for that page will appear.
You can then see how successful each of these traffic sources were by looking at the time spent on the page and the bounce rate. Did they spend enough time there to read the post? Did they only read that post then leave? If you have a high bounce rate you may want to consider adding a call to action at the bottom of the post to keep them on your website.
Want to learn more about Google Analytics?
Check out some of our past posts on using your analytics to improve your website.