By Tyrone Burke
Photos by Chris Roussakis
Canada’s National Capital Region is a whole lot bigger than most metropolitan areas. At nearly 5,000 square kilometres, it’s almost as large as Prince Edward Island. The National Capital Commission (NCC) owns more than 11 per cent of that land.
It’s responsible for 1,700 properties, including major green spaces like Gatineau Park, iconic public spaces like the Rideau Canal skate way, and hundreds of heritage buildings.
Those properties are spread through the cities of Ottawa and Gatineau. Some are centrally located, others are inconspicuously tucked away in the greenbelt. To better visualize and manage their diverse property portfolio, the NCC has teamed up with the Carleton Immersive Media Studio (CIMS).
In 2017, CIMS discussed the possibility of creating a digital twin of the entire National Capital Region for use by key players who guide the region’s development: the City of Ottawa, Ville de Gatineau, Public Services and Procurement Canada and the NCC. The idea was to create something that all of the organizations could use.
“It would need to be flexible in terms of the software platform, and also the different uses that everyone would have for it,” says CIMS Associate Director Lara Chow.
Working with Detailed 3D Models
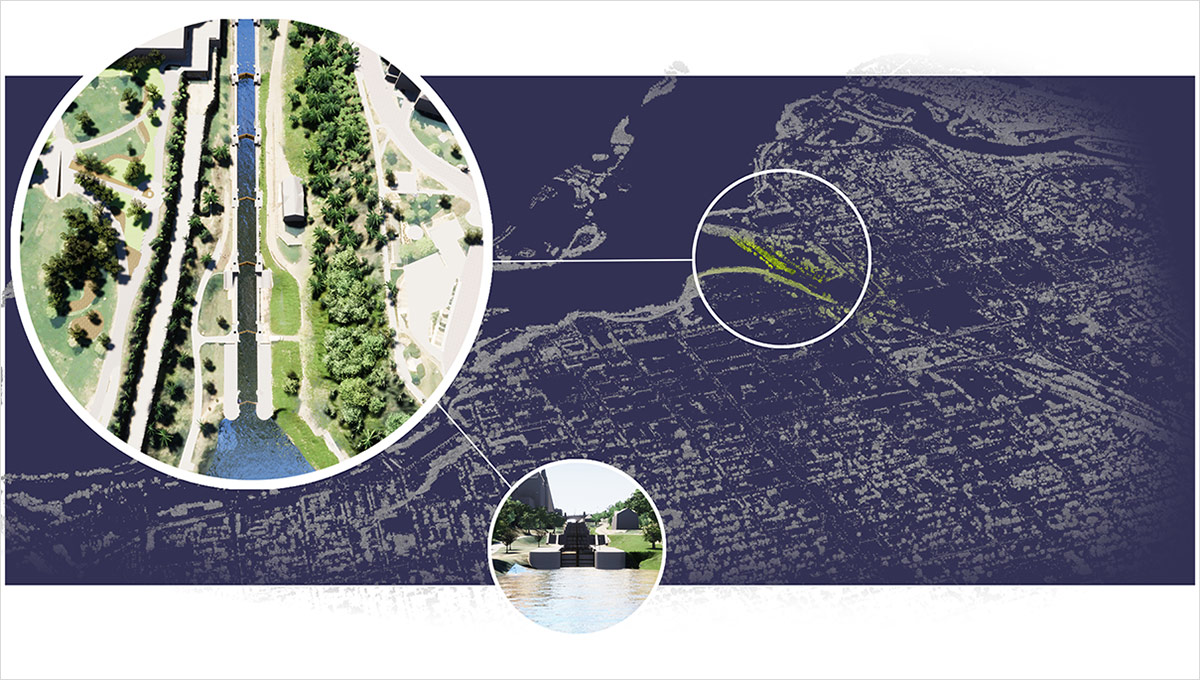
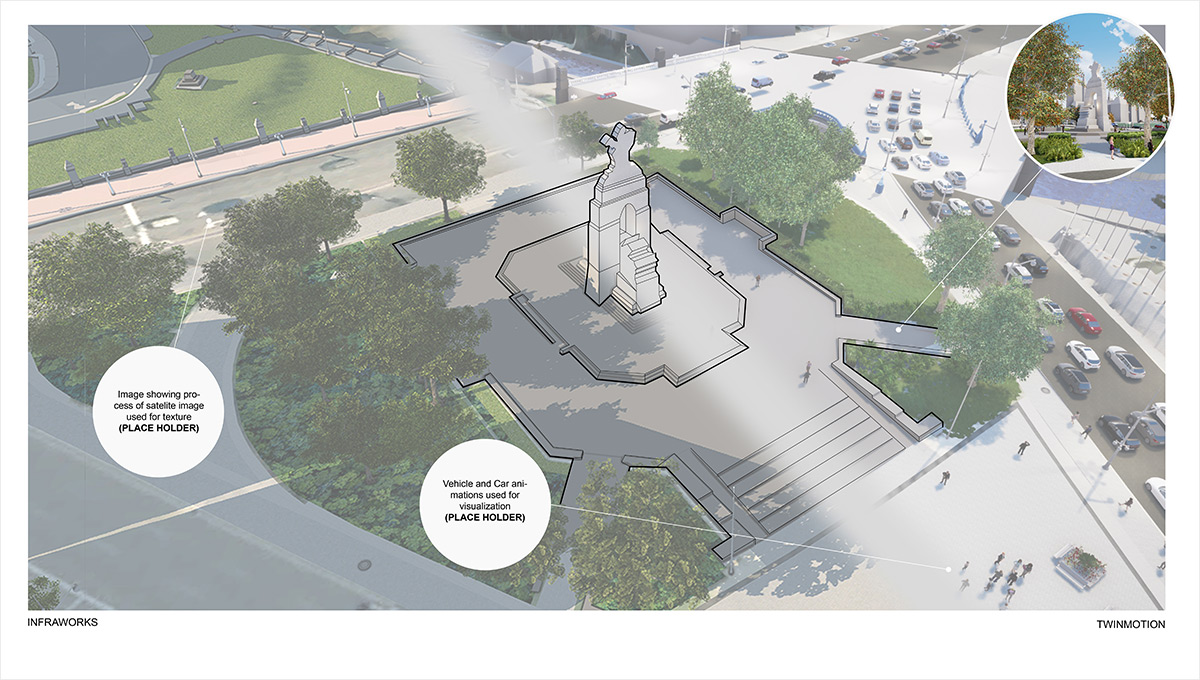
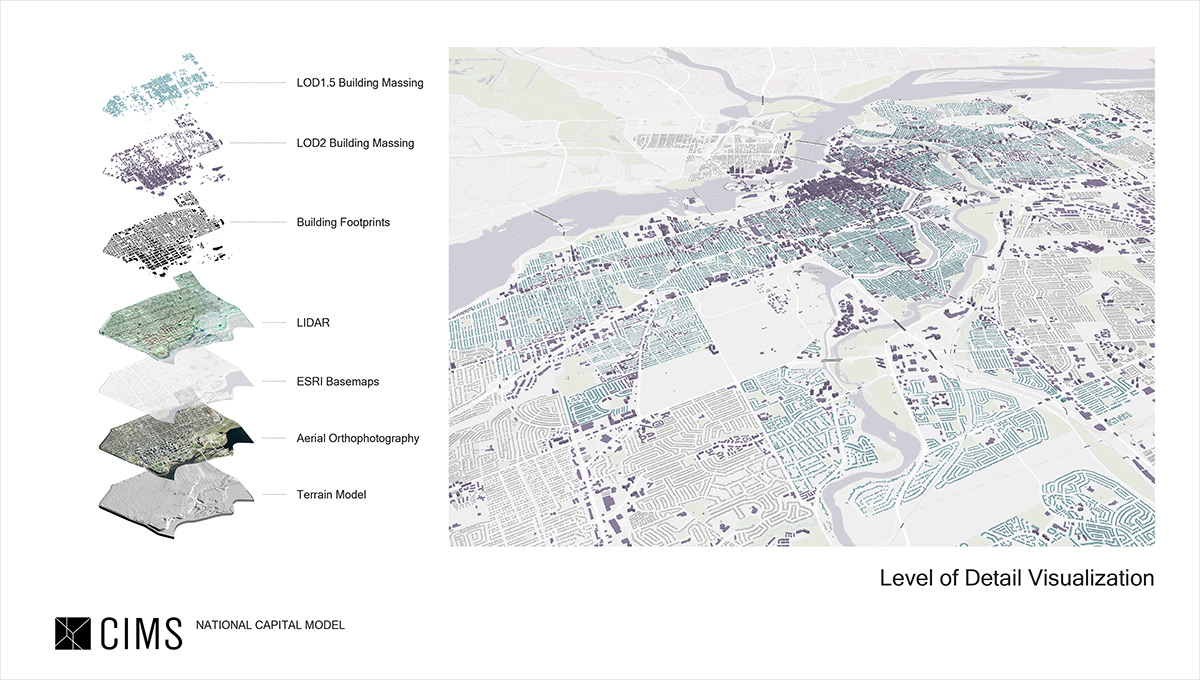
That effort stalled, but the following summer, CIMS began work on detailed 3D models of the NCC’s properties and assets. CIMS has created an urban model of the core NCC region, an irregularly shaped area that stretches from Lebreton Flats to Rideau Hall, and spans both sides of the Ottawa River. They’ve created detailed models of high visibility properties like the National Holocaust Monument and Lebreton Flats, and a model database of NCC assets such as street furniture and light standards.
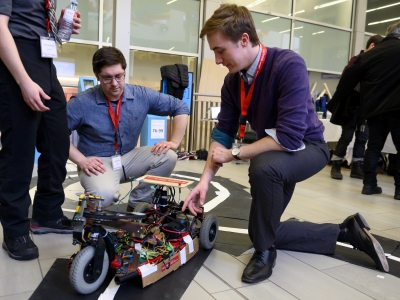
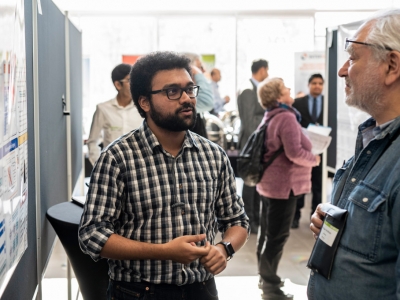
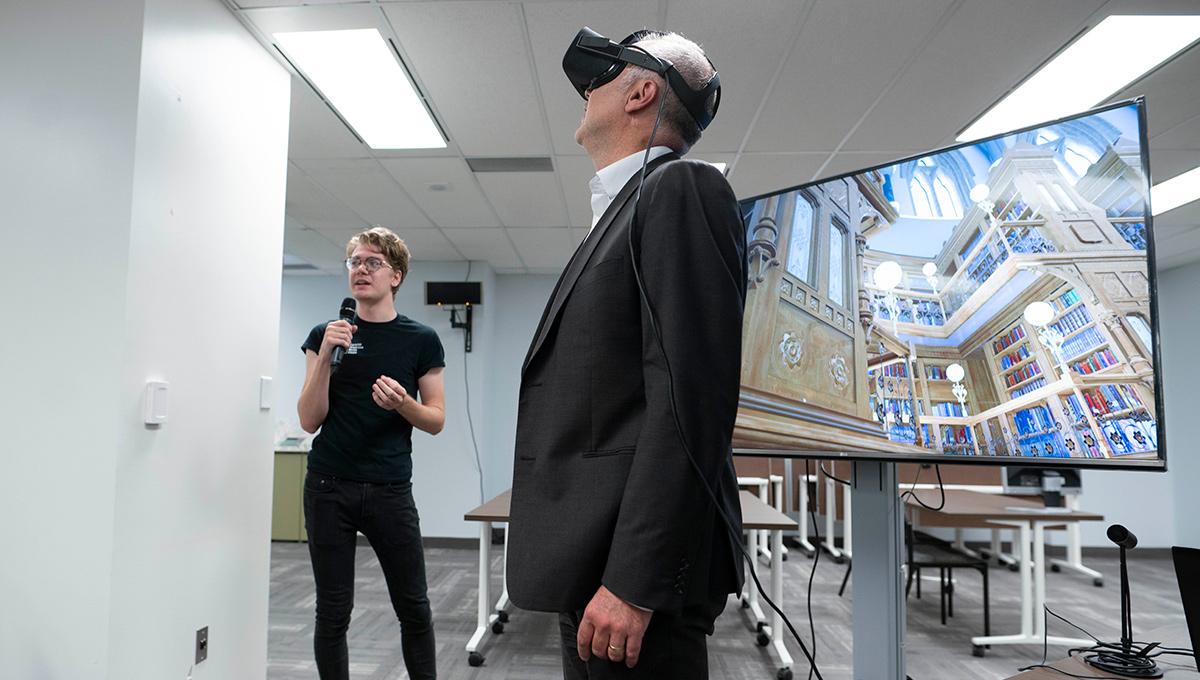
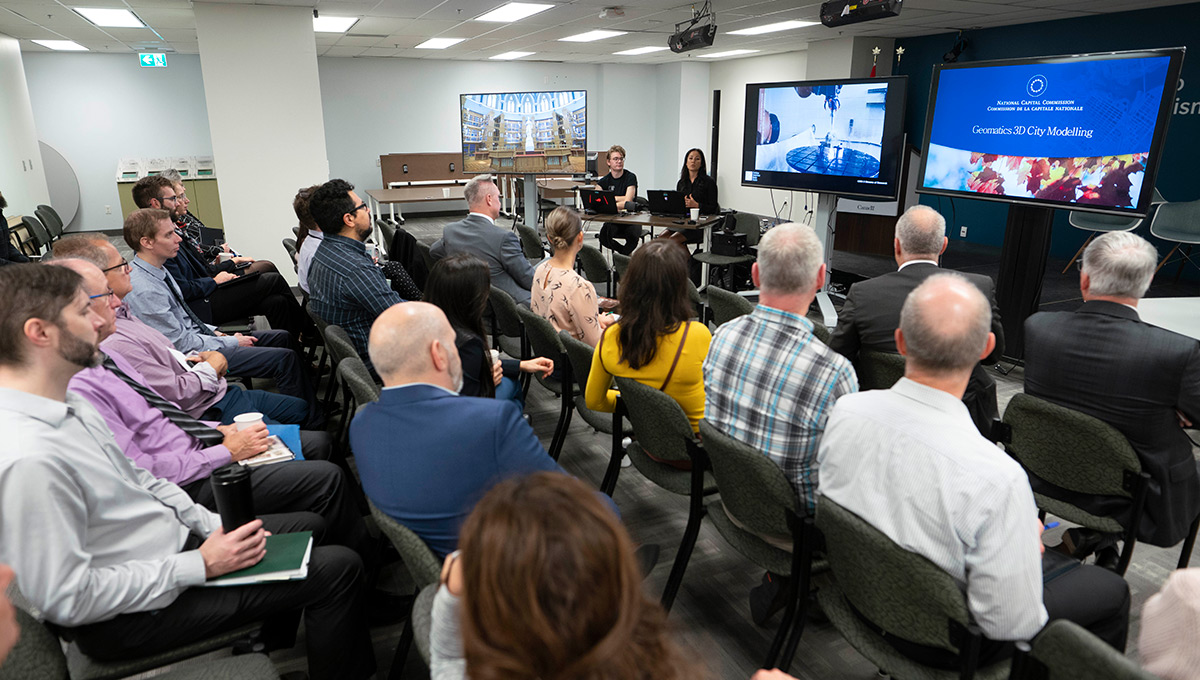
On Sept. 26, 2019, CIMS shared their progress with the NCC’s Geomatics Services Team at the NCC’s Capital Urbanism Lab, at an event attended by new NCC CEO Tobi Nussbaum.
“The model is not only a powerful visualization tool, but also very powerful tool for analysis – an asset information model,” says Chow.
“When we create a building information model (BIM), each object has metadata associated with it. If you click on a window, it can tell you the manufacturer, when it was replaced, the cost. You can see a building’s zoning and who built it. There is a really powerful database behind it. But the challenge is that BIM is typically used for new construction. What we’ve done is apply it to heritage buildings.”

A Repeatable Sandbox to Play In
The modelling process begins with a terrestrial laser scan that records the surface of a building by collecting coordinate and colour data. Scanning produces point cloud data – information about millions – even billions — of individual points. This is imported into a BIM authoring software, where researchers transform it into a realistic digital model of a building by generating model geometry. Then, non-graphical information like the cost of a window or its date of installation can be added to each object’s metadata.
This doesn’t only help the NCC understand the properties as they already are, it makes it easier to envision what could be.
“If we just wanted to see a site, we could go outside and look at it. We could even stay inside, and look at Google Earth. So, why go to all this trouble? The answer is a question: ‘What if?’” says Matthew McIntyre, a survey analyst with the NCC who spoke at the event.
“By spending the time to compile this data, we now have a repeatable sandbox to play in. Anybody can ask a ‘what if’ question, and we can test that scenario. Traditionally, we’d be asked to start by providing a topographic survey. Now, we can begin by building a model.”
Monday, October 7, 2019 in Architecture, Feature Stories, Industry Collaboration, Research
Share: Twitter, Facebook