As to be expected, each September we see a spike in stats. Service Desk calls are up, wireless traffic is up, and web stats are up.
In fact, we saw a 93% increase in web traffic to the ITS website from August to September. Not surprising.
And the stats are even up from last September:
- sessions are up 3.9%
- pageviews are up 4.3%, and
- bounce rate has improved by 1.6%
Meeting our SEO Goals
In ITS we continue to focus our efforts on optimizing our website for search engines, and currently 67% of our traffic to the site is coming from search engines. (If you’d like to learn how to optimize your site, you may want to attend SEO workshop that Web Services is hosting in November).
Tracking our Website Goals
One of the goals of the ITS website is to provide useful online documentation. We determine whether or not the material is useful by looking at hits to the page, time spent on page, and where they went next (did they call us? did they go to other documentation? did they leave the site?). We then use this information to improve the documentation. This goal will be easier track once we move our documentation over to the new Knowledge Base, which we plan to have in place by January.
ITS Web Stats: Infographic
Below is an overview of some website stats from the month of September. The accessible transcript is posted below.
Accessible Transcript
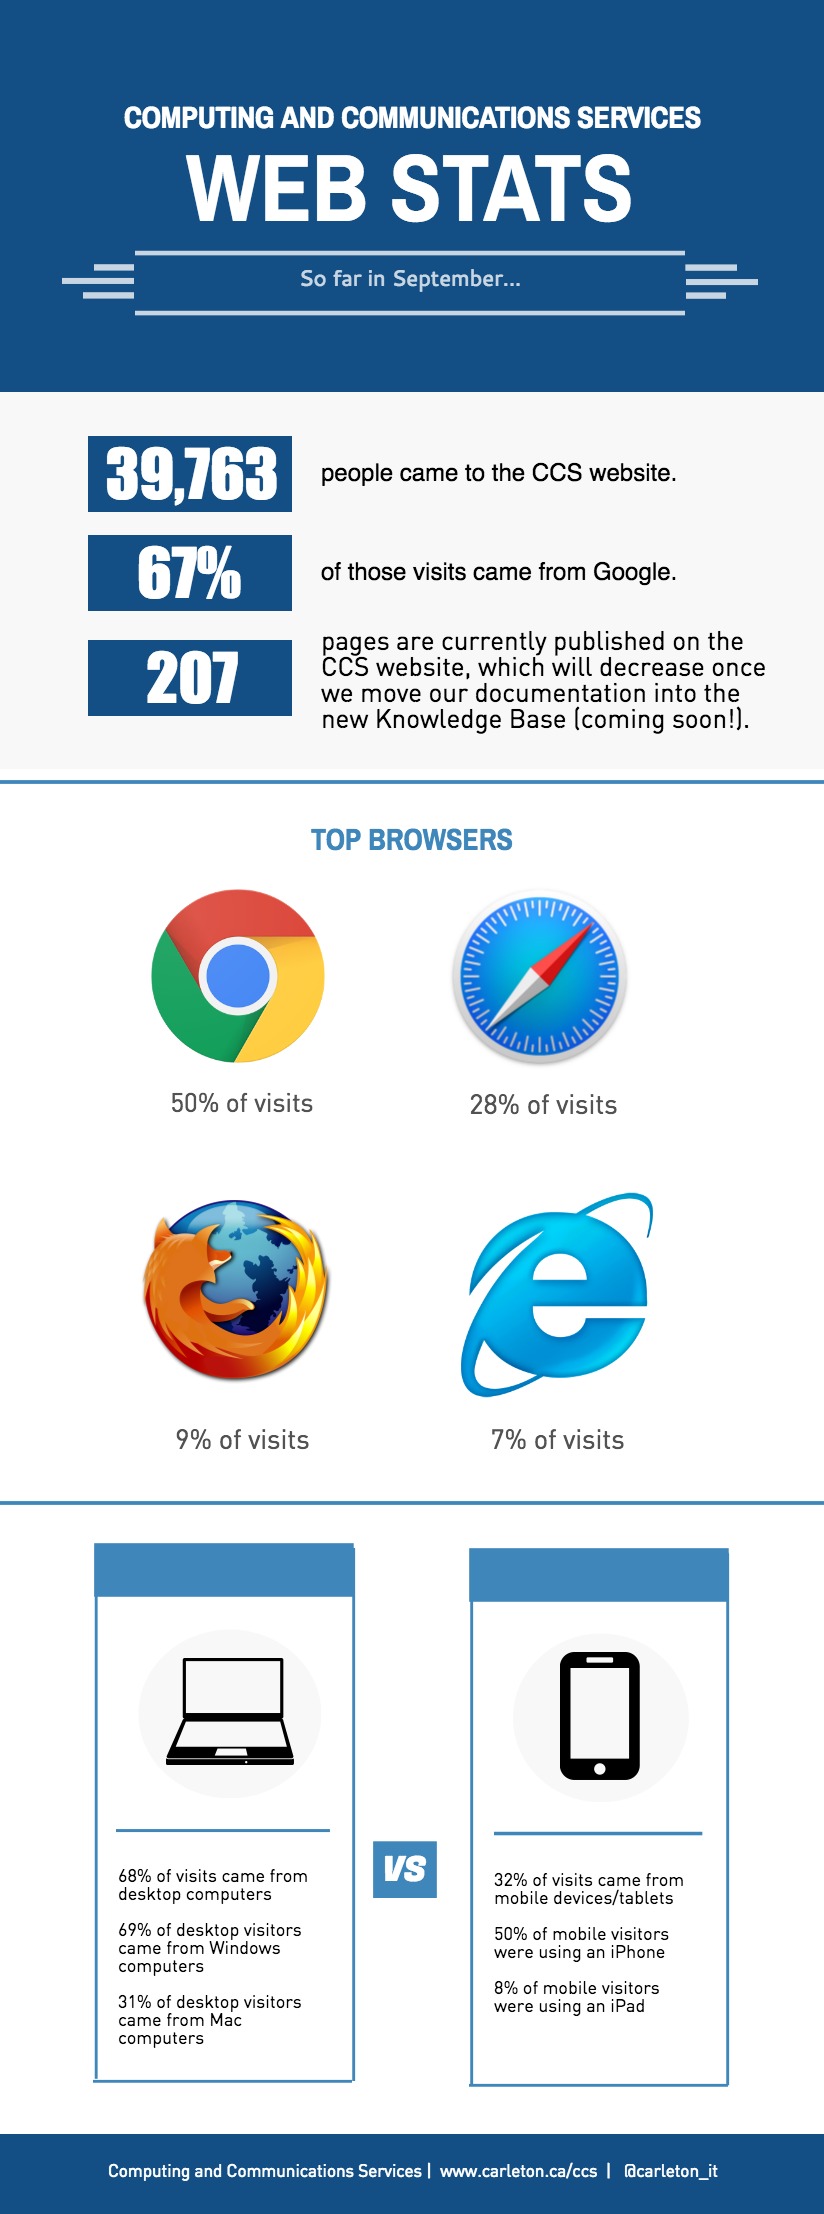
Information Technology Services web stats. So far in September..
- 39,763 people came to the ITS website.
- 67% of those visits came from Google
- 207 pages are currently published on the ITS website, which will decrease once we move our documentation into the new knowledge base (coming soon)
Top Browsers:
- Chrome: 50% of visits
- Safari: 28% of visits
- Firefox: 9% of visits
- IE: 7% of visits
Desktop:
- 68% of visits came from desktop computers
- 69% of desktop visitors came from Windows computers
- 31% of desktop visitors came from Mac computers
Mobile:
- 32% of visits came from mobile devices/tablets
- 50% of mobile visitors were using an iPhone
- 8% of mobile visitors were using an iPad
Information Technology Services | carleton.ca/its | @carleton_it