To complete this module and the next, you’ll need access to Google Analytics. If you don’t already have a login or access to your analytics, follow along with this tutorial to get your account set up.
Learning Outcomes
By the end of this module, you will:
- Understand how to navigate Google Analytics to see how your site is performing
- Translate analytics data into changes you can make to your pages
Estimated time to complete: 30 minutes
Module
Analytics allow you to understand how your site is performing, by providing you with actual data on how visitors are interacting with your site.
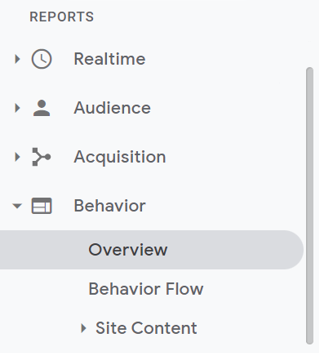 To get an idea of how your site is performing overall, go to Behaviour > Overview in the left-hand menu. Change the date range by clicking the dates in the top right corner and typing in your desired date range. The page will then display average stats like pageviews, bounce rate, and average time on page for your website within the selected time period.
Below the chart, you can also see the most viewed pages on your site. Take note of these and compare them to the pages you have deemed essential. Are the pages that are most important to fulfilling your website’s goals the ones that are being viewed? You can click “view full report” in the bottom right to see all of your pages.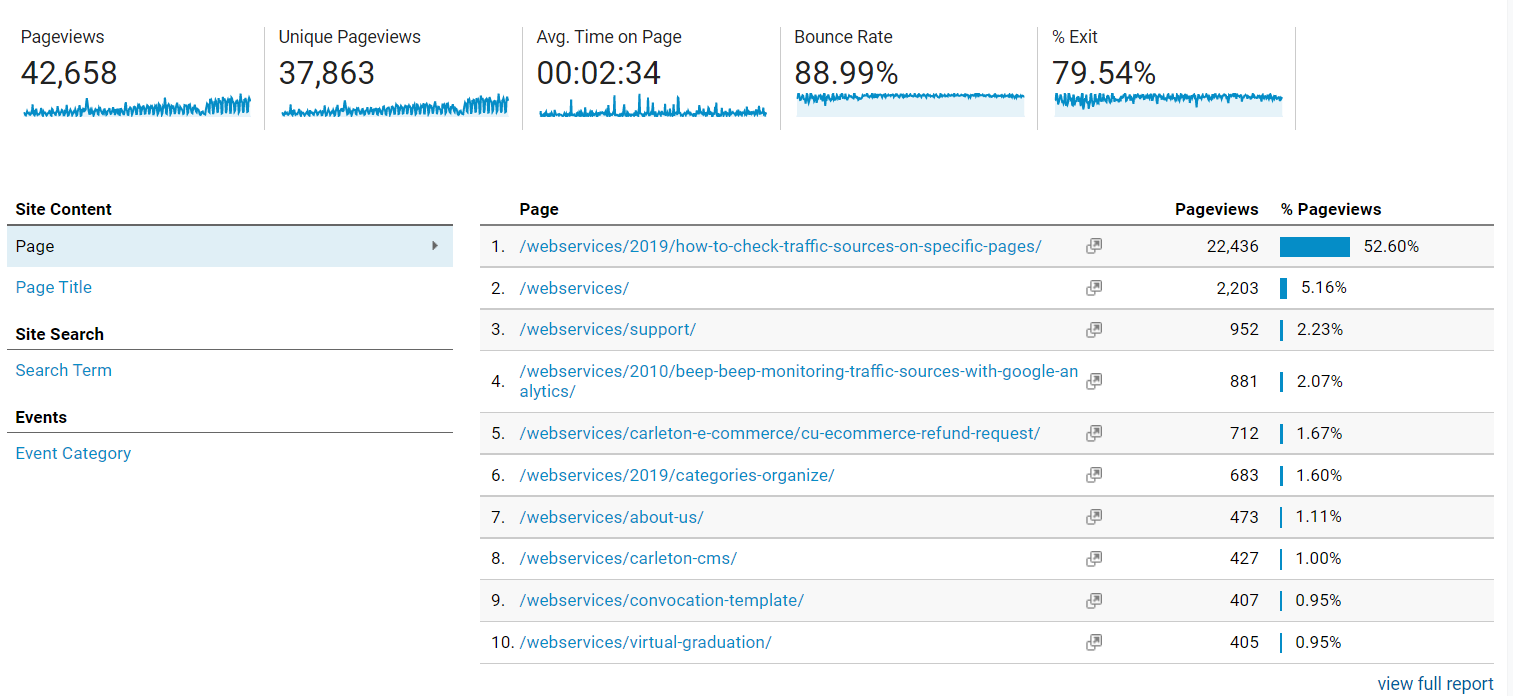
Pay special attention to your homepage. How many page views does it get? How long did people stay on this page? How did they get there (Email, search etc.)? What is the bounce rate like?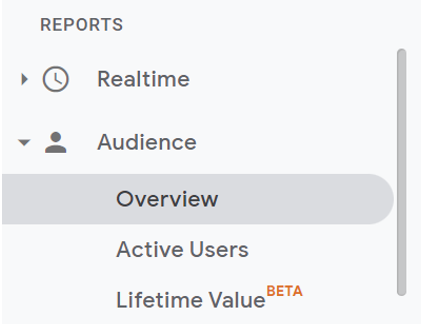
Next, go to Audience > Overview. Google Analytics should keep the date range you have previously applied, but you can check this in the top right corner. Take note of pertinent information such as users, sessions, page views, session duration and bounce rate.
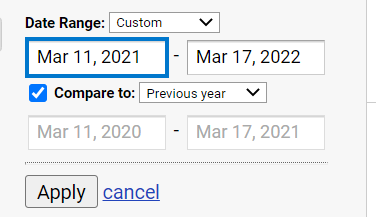 In the date range, click Compare To and select Previous Year. Here, you can compare trends from year to year. Is the number of users and page views going up or down? Why might this be?
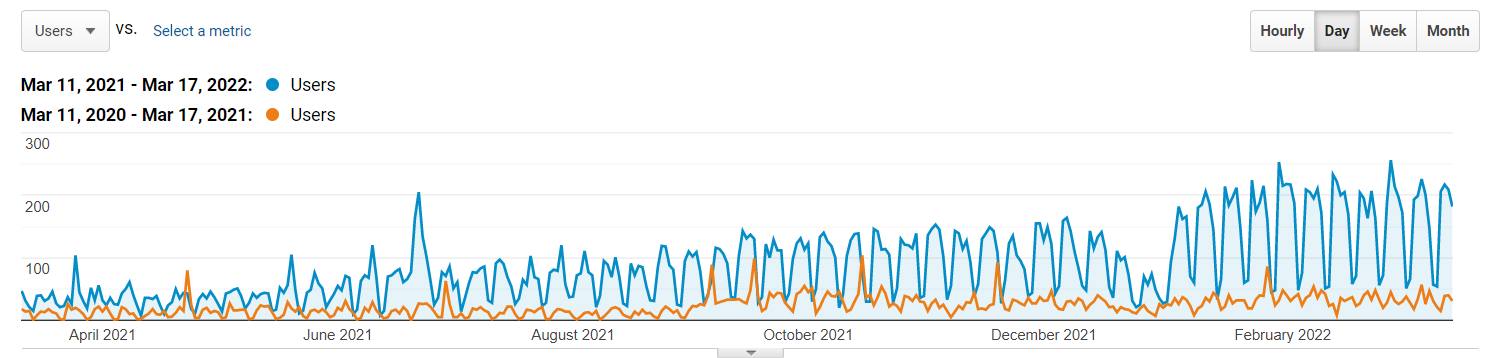
For further tips and tricks on how to translate analytics into meaningful changes to your website, see our post on 5 easy ways to improve your site using Google Analytics.
Video Tutorial
Transcript
Take Action
Take note of data such as pageviews, users, bounce rate, and demographics. This data can help you understand how your pages are being interacted with and help you better refine your website. Here are some examples of what you can use this data to do:
- Open important pages with the high bounce rates. Can you identify what might be making people click away from these pages? Huge blocks of text, technical errors or elements not displaying properly can be major factors in bounce rate.
- Open the pages you have identified as vital to your website’s purpose. Compare those with less page views to those with higher page views and ones with lower bounce-rates to ones with higher bounce-rates. Why might some of these pages perform better than others? What can you change to improve low performance?