After all this talk about the EU, Spain, Canada and international organizations, we still have not considered the fate of the turbot, the source of the dispute.
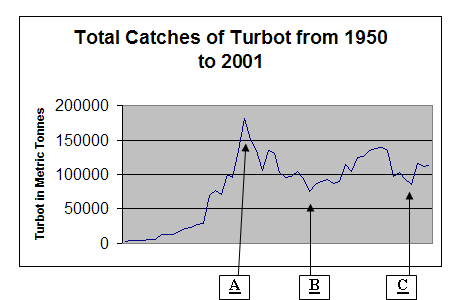
The following graph represents the amount of Turbot caught off the Grand Banks region from 1950 to 2001. The y-axis represents the amount of Turbot caught in metric tonnes and the x-axis represents the year.

Look at the graph and select the letter that you believe represents the total catches for 1995.
Is it: