Once an assessment in D2L Brightspace has been completed and graded, instructors are able to access aggregate and individual statistics related to the grades. In your course’s Grade Book, you can find two types of reports related to grades: Grade Statistics and Event Logs.
Grade Statistics
The Grade Statistics in Brightspace contain Class Statistics as well as Individuals User (student) grade statistics.
Grade Statistics
Accessing the grade statistics page allows access to Class Statistics tab and User Statistics tab within your course.
To access the grade statistics page:
- Log into your course with your MyCarletonOne credentials.
- Click on Progress in the NavBar.
- Select Grades from the drop-down menu.
NOTE: If you haven’t yet set up your gradebook, you will be prompted to do so. - Click on either the Manage Grades tab or Enter Grades.
- Click on the action menu next to the grade item of interest.
- Select View Statistics from the drop-down menu.
You now have two options for statistics to access: Class Statistics and User Statistics. - Select the Class Statistics or User Statistics Tab.
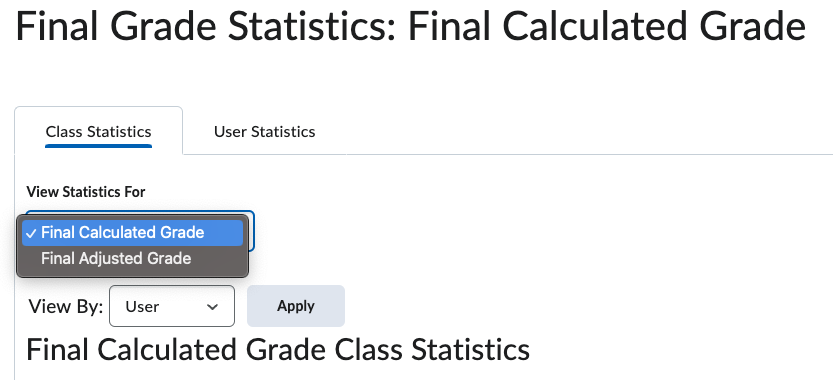
- Click the View Statistics For drop-down menu. You can change the View By field to User, Group, or Section if you have groups and/or sections in your course. This can be helpful to try and compare grades by different TA Groups or different teaching sections.
| NOTE: When viewing statistics for Brightspace’s Final Calculated Grade item, you have the additional ability to toggle between this grade item and the Final Adjusted Grade item. |
Class Statistics
The following are explanations for each of the statistics presented in the Class Statistics tab.
- Number of submitted grades: The numerator in this expression is a count of the values contributing to the class-level statistics. For example, in a course wherein 21 grades have been computed, this value will be 21. The denominator denotes the number of possible values (i.e., the number of grade-earning users — often learners — in the course).
| NOTE: The numerator in this expression does not include 0’s that have not been entered manually. This means that if you use the setting Treat all ungraded items as 0, these automatically generated 0s are not contributing to the statistics. |
- Minimum: The lowest grade achieved on this grade item, expressed as a percentage. This value does not include ungraded items that are treated as zero.
- Maximum: The highest grade achieved on this grade item, expressed as a percentage. This value does not include ungraded items that are treated as zero.
- Average: The sum of all the grades for this grade item divided by the number of submitted grades, expressed as a percentage. This value does not include ungraded items that are treated as zero.
- Mode: The most frequently earned grade on this grade item, expressed as a percentage. This value does not include ungraded items that are treated as zero.
- Median: The middle of the distribution (i.e., the value that sits in the position of minimum plus half of the range), expressed as a percentage. This value does not include ungraded items that are treated as zero.
| TIP: The Average, Mode, and Median are all measures of central tendency. The closer these numbers are to each other, the more normally distributed your grades are for this grade item. If one of these measures is very different, it might be worth investigating why that is (e.g., is there a student who earned a significantly lower grade compared to their peers? If so, why is that?) |
- Standard Deviation: To complement the measures of central tendency, standard deviation is a measure of dispersion in the data. This statistic measures how spread the data is; that is, on average, how far away is the data from the average. This standard deviation uses the population computation, as it is assumed that this parameter is meant to describe users who participated in the evaluation; this means that it is not meant to be used as a statistic to infer to a greater population of interest.
| NOTE: If you have a large standard deviation, this might be indicative of inconsistent performance among your students. This is a flag to indicate that grades should be investigated (e.g., why is there such a large discrepancy in grades?) |
- Grade Distribution: This Figure is a histogram that depicts the percentage of students (y-axis) who have received a certain range of grades, expressed as a percentage (x-axis). Grade received (%) is binned into 5% ranges and the height of the bars indicates what percentage of students eared a grade within that 5% range.
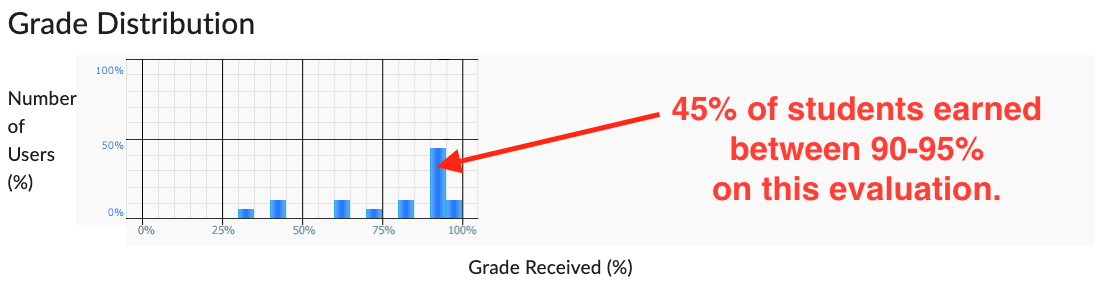
In the example Grade Distribution shown above, 45% of students earned between 90-95% on this evaluation.
User Statistics
The User Statistics Tab allows you to compare students’ performance on one evaluation with other evaluations. The table presents a list of students and their grade, expressed as a percentage, on the grade item chosen. Click on Show Search Options to explore these data in more detail.
To Filter User Statistics:
- Access the Grade Statistics Page.
- Select the User Statistics Tab.
- Under Score, click on the select box to activate it.
- Choose a different grade item
- Choose with operator you’d like to use
- =: score on chosen grade item is greater than or equal to the typed value, as a percentage.
- < =: score on chosen grade item is less than or equal to the typed value, as a percentage.
- >: score on chosen grade item is greater than the typed value, as a percentage.
- <: score on chosen grade item is less than the typed value, as a percentage.
- =: score on chosen grade item is equal to the typed value, as a percentage.
- Type the value you’d like to compare against (as a percentage); this must be a numeric value.
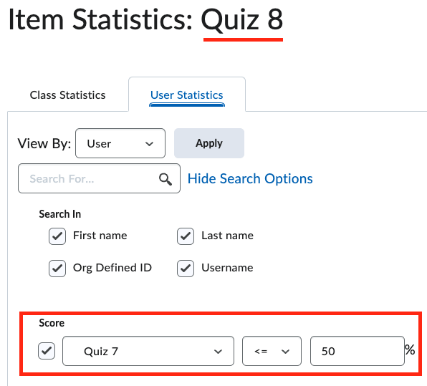
The image above is an example of filtering the User Statistics for Quiz 8 by students who received less than or equal to 50% on Quiz 7.
Event Logs
The D2L Brightspace Grade Book has two kinds of event logs: Overall Event Log and Grade Item Event Log. The Overall Event Log will provide you with information related to the creation, deletion, and restoration of grade items. The Grade Item Event Log will provide you with information related to any changes made for each grade item separately.
To Access the Overall Event Log:
- Log into your course with your MyCarletonOne credentials.
- Click on Progress in the NavBar.
- Select Grades from the drop-down menu.
NOTE: If you haven’t yet set up your gradebook, you will be prompted to do so. - Click on the More Actions button.
- Select View Event Log from the pulldown menu.
From here, you’ll see a Table of all the changes that have been made to the grade book in your Brightspace course. If you click on Show Search Options, you’ll see that you can filter the Table by Action (I.e., Created, Deleted, or Restored) and Date (start dates and end dates related to the grade item; i.e., not the associated evaluation). Additionally, you can search within the grade item name and grade id.
In the Item column, you can click on the grade item name to be brought to the Edit Settings page for that grade item.
To Access Grade Item Event Logs:
- Log into your course with your MyCarletonOne credentials.
- Click on Progress in the NavBar.
- Select Grades from the drop-down menu.
NOTE: If you haven’t yet set up your gradebook, you will be prompted to do so. - Click on either the Manage Grades tab or Enter Grades.
- Click on the action menu next to the grade item of interest.
- Select View Event Log from the pulldown menu.
From here, you’ll see a Table of all the modifications that have been made to this specific grade item. The Table indicates the modification (e.g., grade item description), when it was changed and by whom. Additionally, you can click Show description to see the previous value.
Click on Show Search Options to filter this by start and end dates associated with the grade item.
Support
For further assistance accessing Brightspace Grade Statistics and Event Logs in your course, contact the Teaching and Learning Services team through the TLS Support Portal.
Was this page helpful?
no one has found this useful yet.
Still need help? Contact us